Solo sign up
 School sign up
Year 2 Statistics – Make Tally Charts – Lesson 1
Year 2 Statistics – Make Tally Charts – Lesson 1
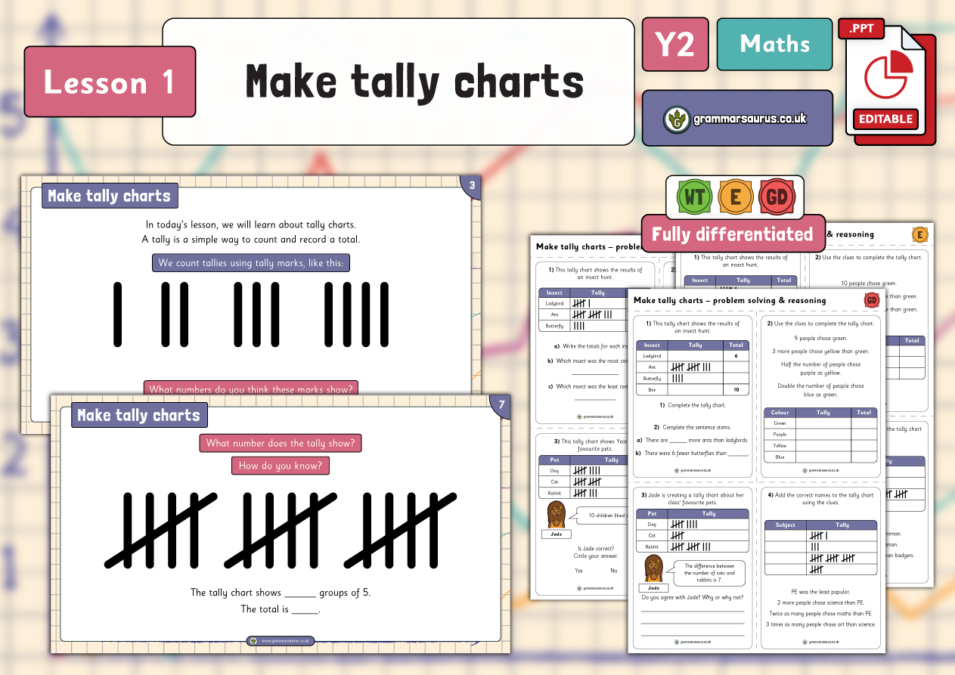
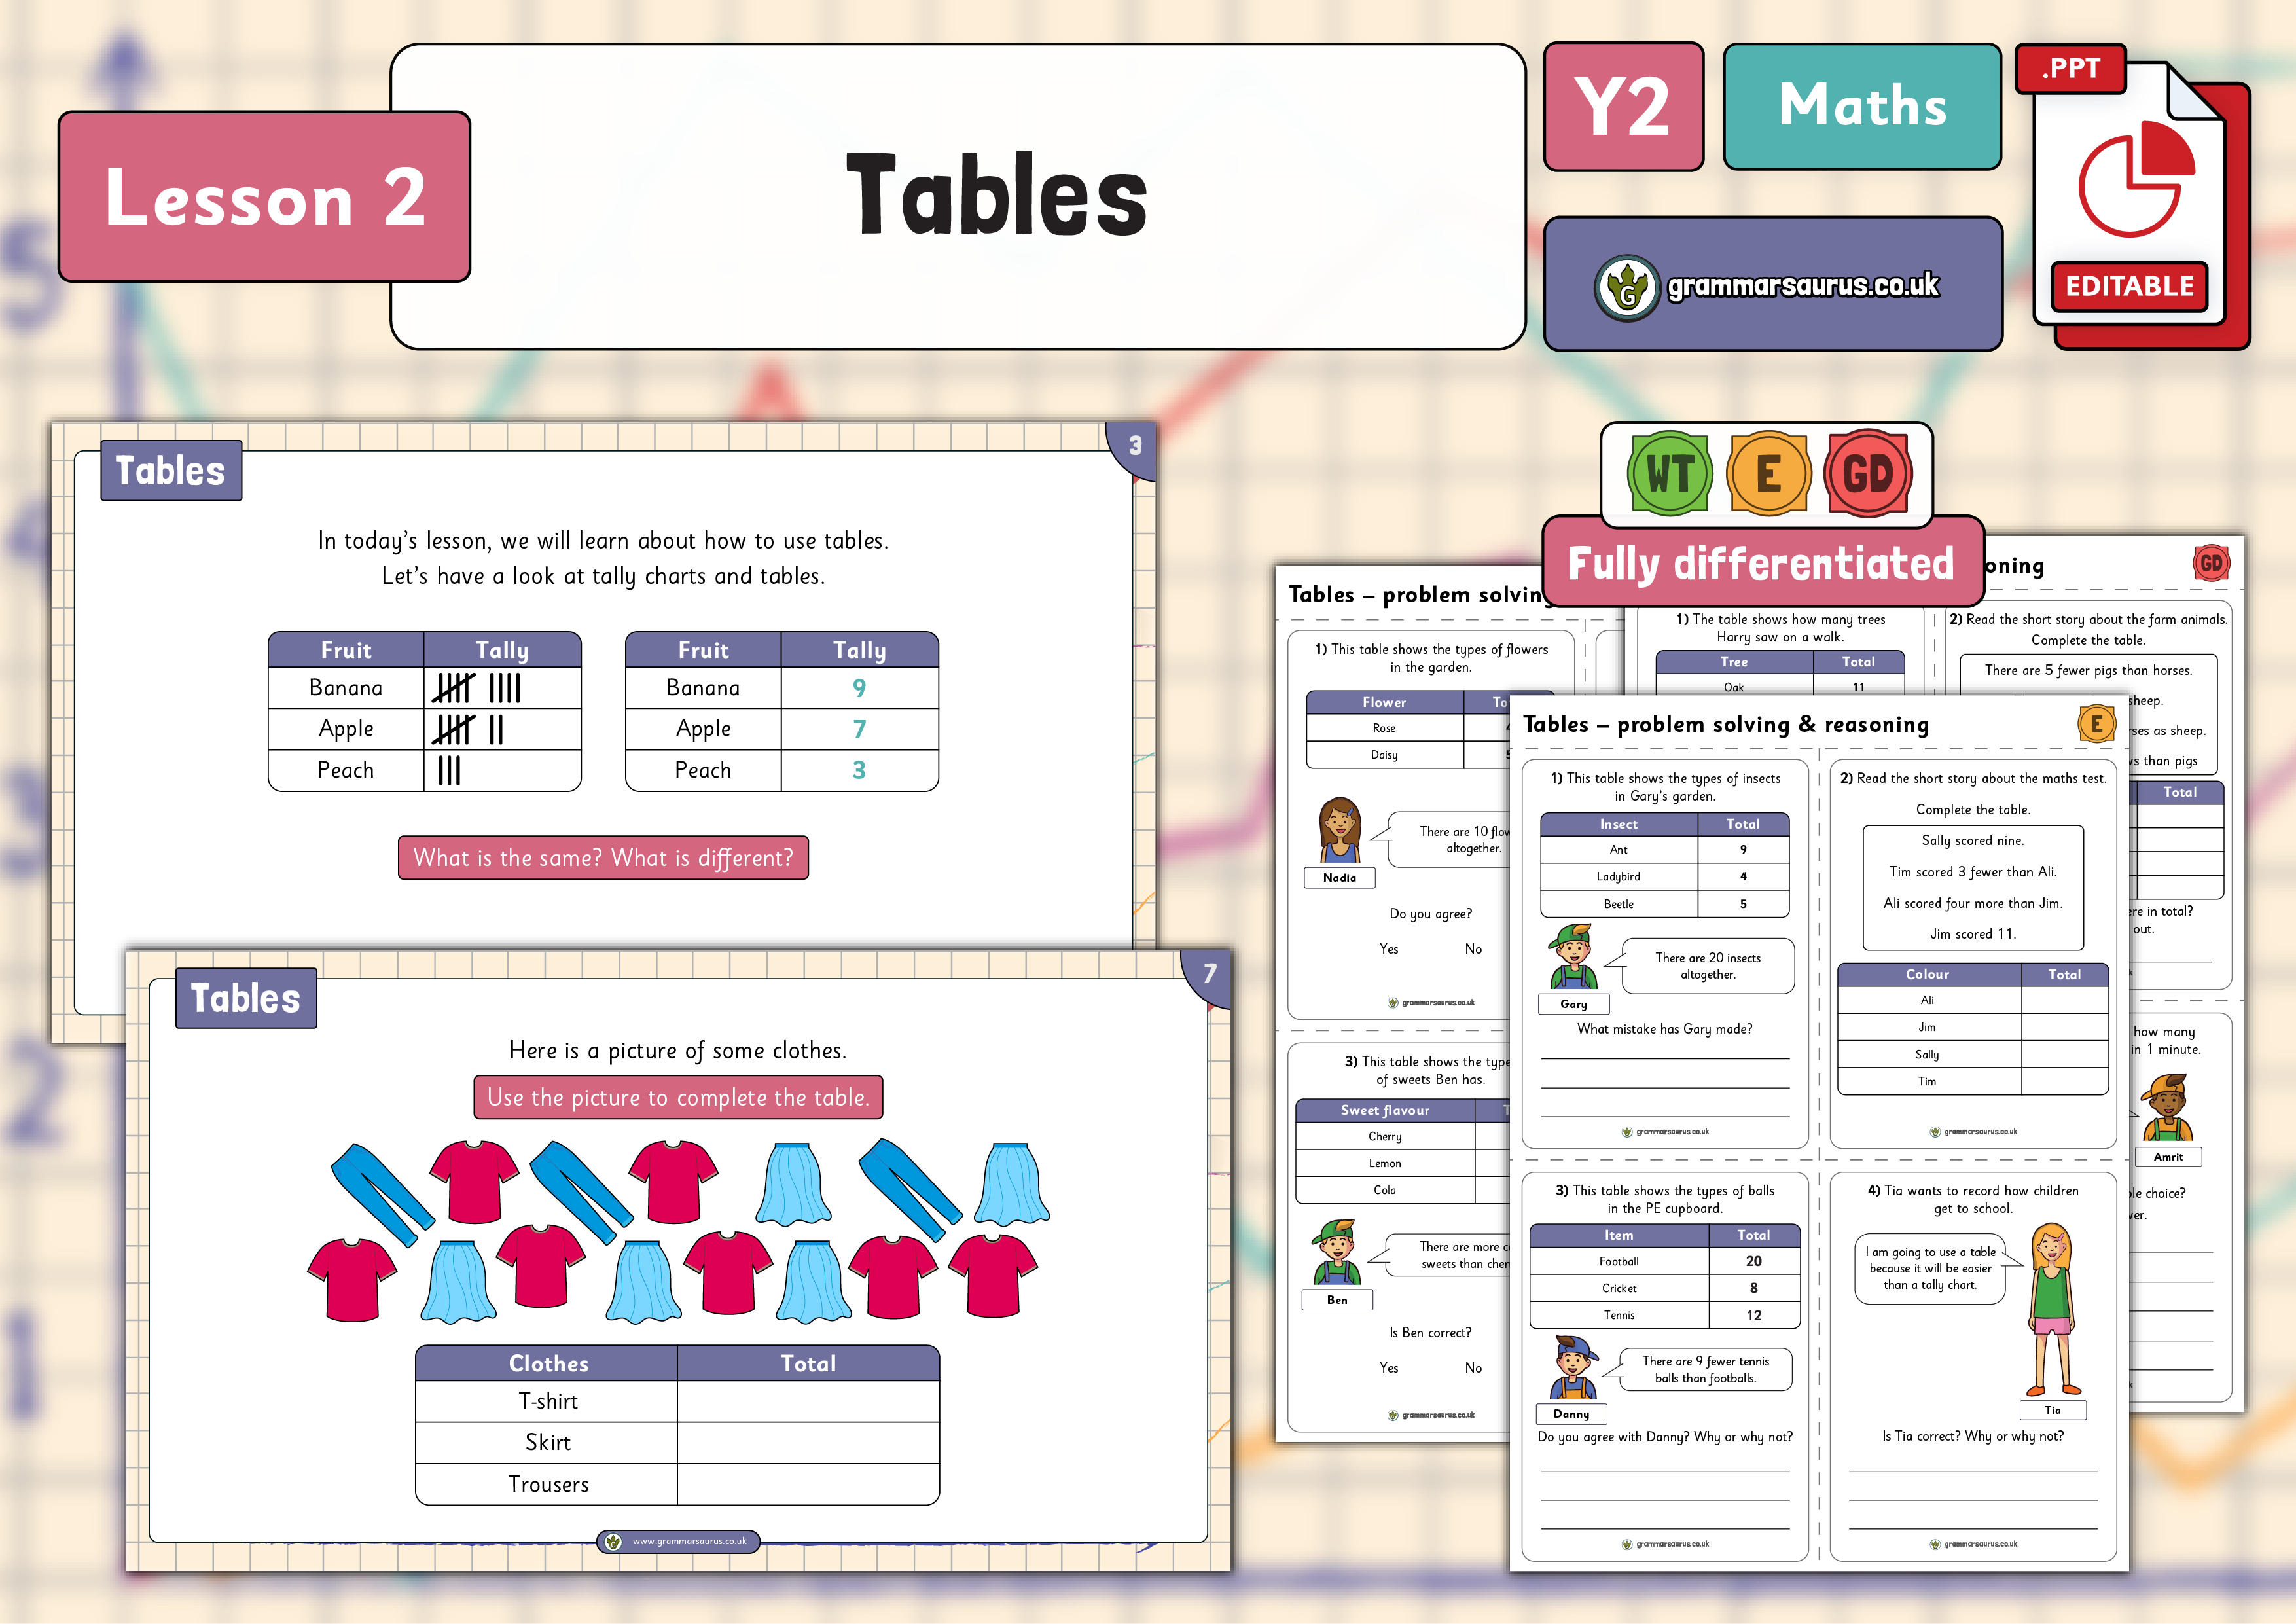
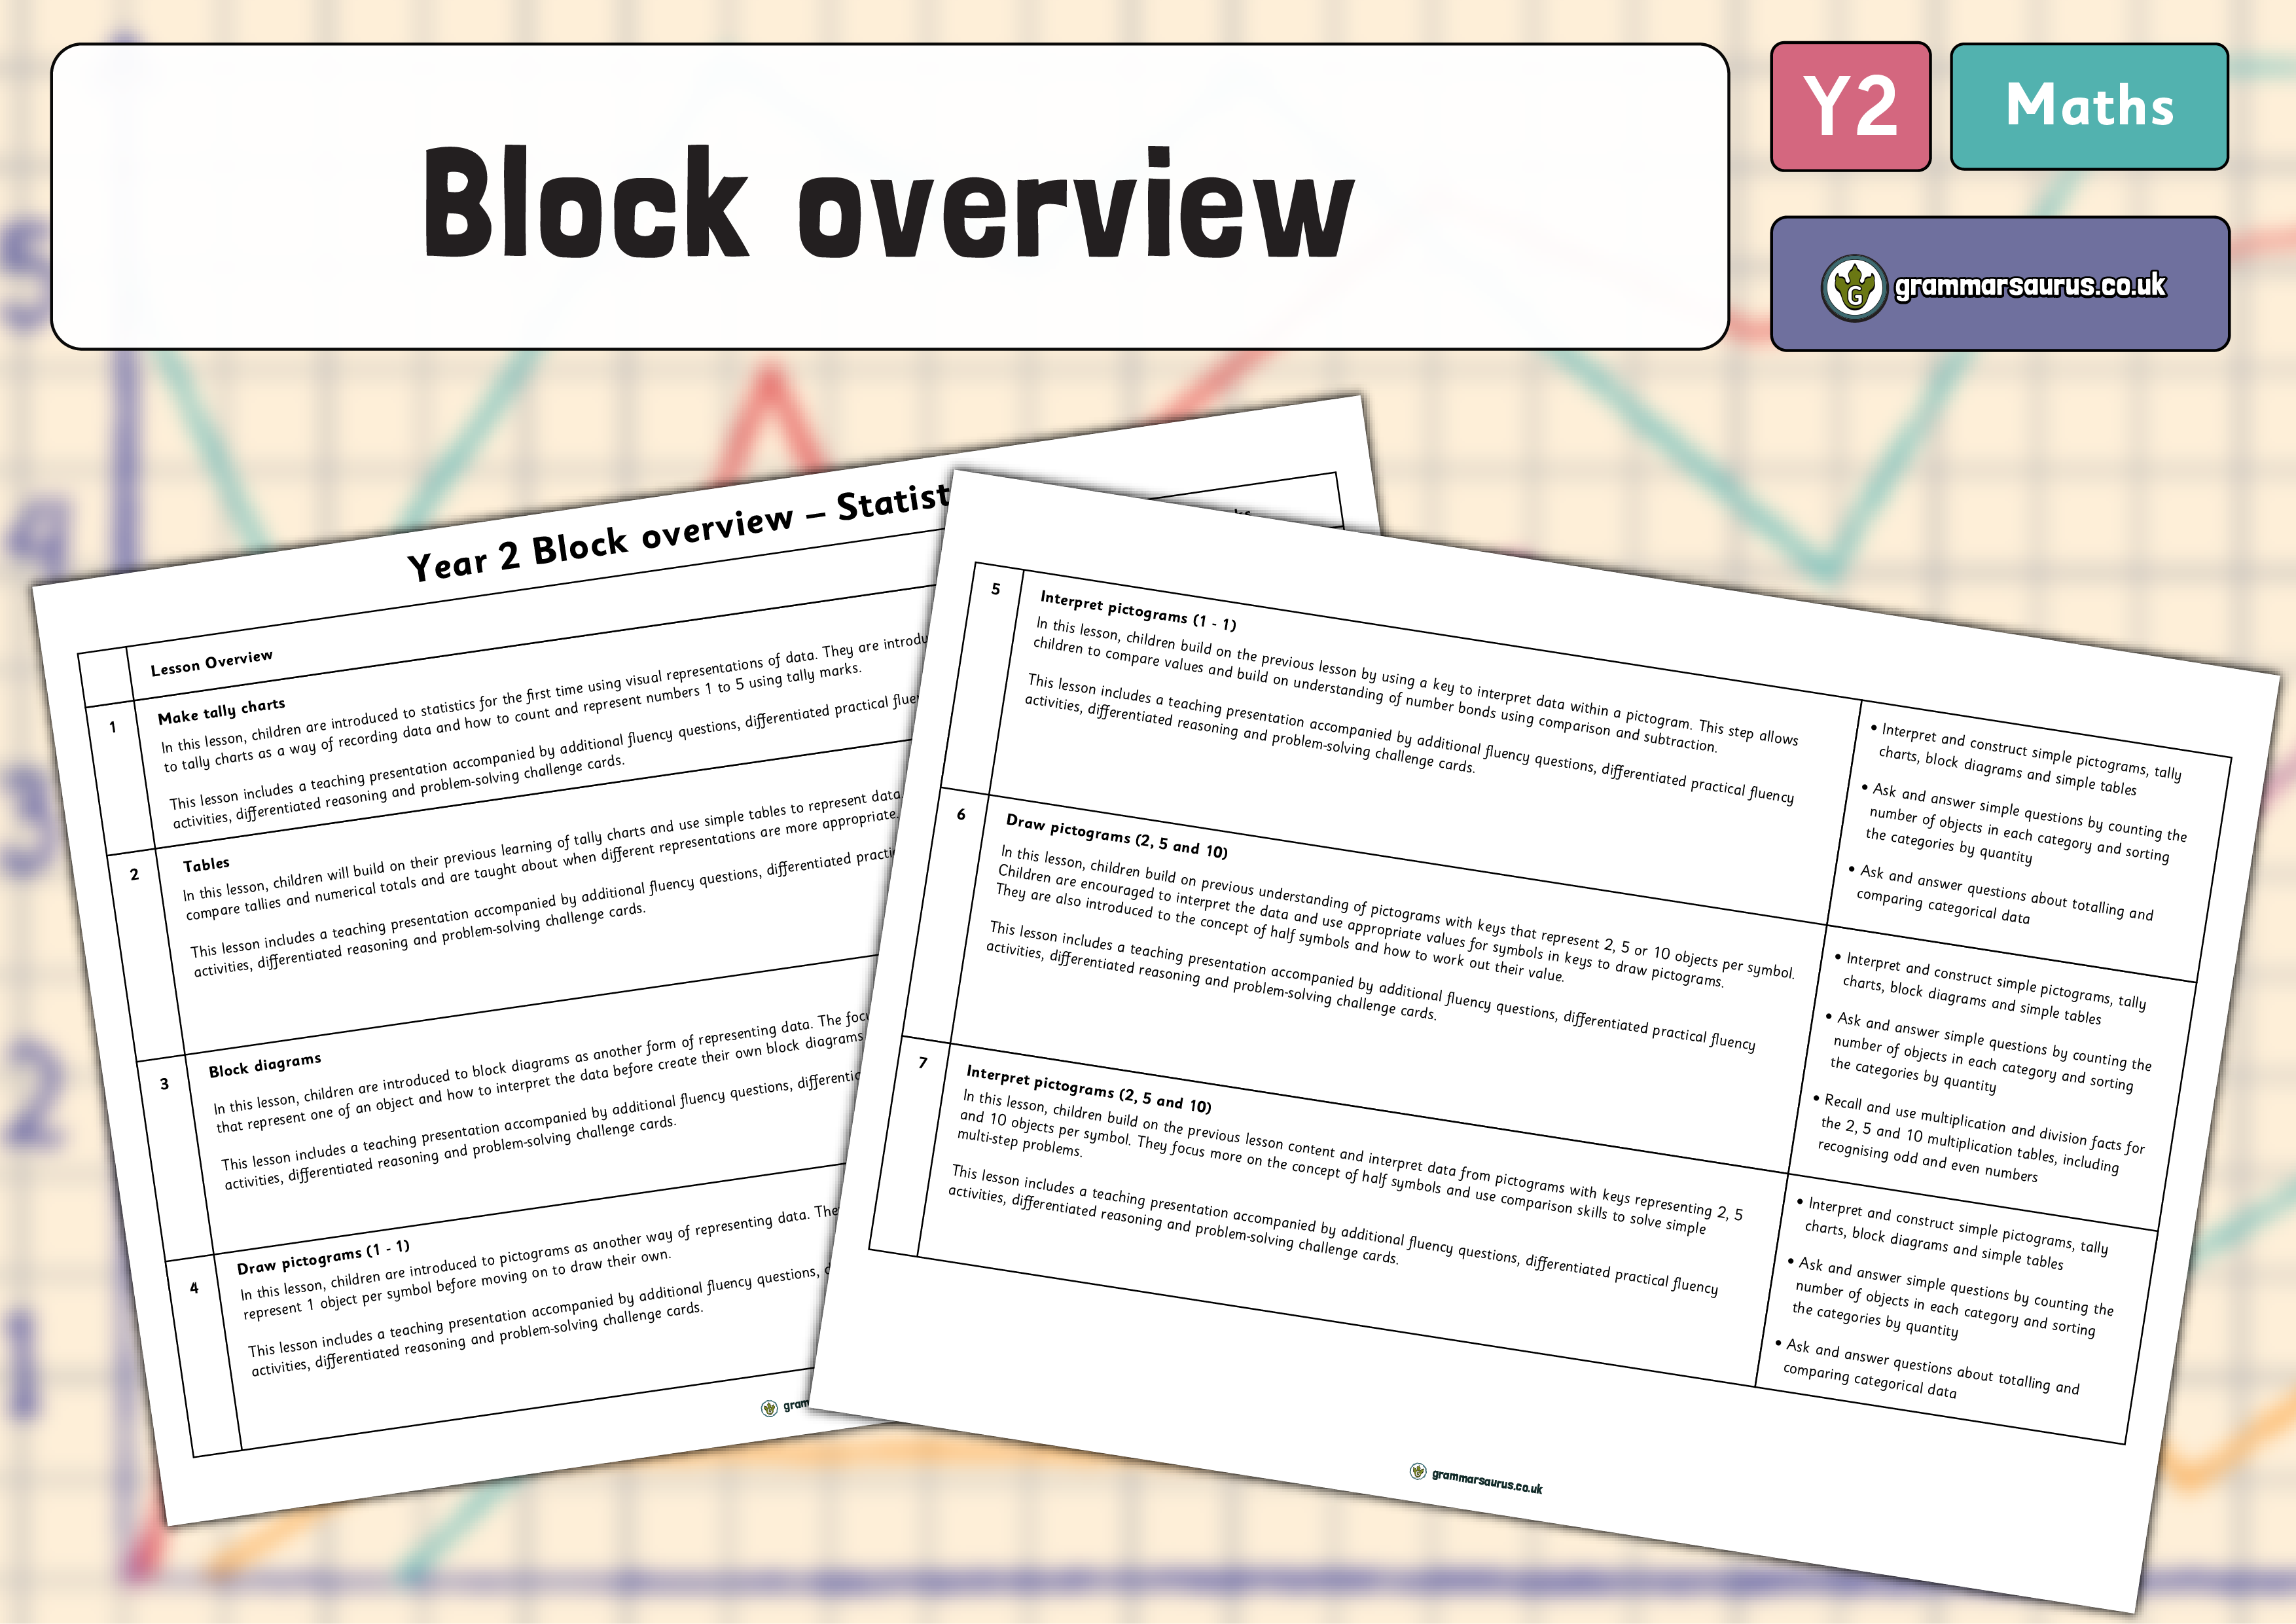
In this lesson, children are introduced to statistics for the first time using visual representations of data. They are introduced to tally charts as a way of recording data and how to count and represent numbers 1 to 5 using tally marks. This lesson includes a teaching presentation accompanied by additional fluency questions, differentiated practical fluency activities, differentiated reasoning and problem-solving challenge cards. National Curriculum objectives: Mathematics Year 2: • Interpret and construct simple pictograms, tally charts, block diagrams and simple tables • Ask and answer simple questions by counting the number of objects in each category and sorting the categories by quantity
Levels of this pack: Age: 6-7 #Summer Block 3...
Hello,
Downloads are for members of Grammarsaurus only.
Please sign up below or login if you are already a member.
Hi! Sign in Or Solo sign up Or School sign up