Year 2 Maths
January 6, 2022
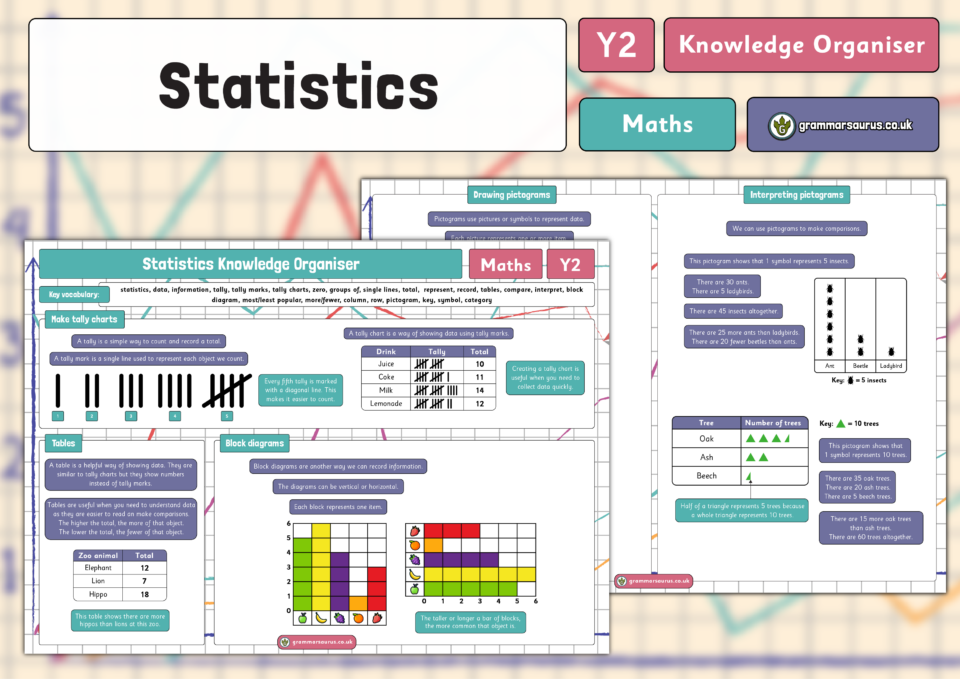
In this lesson, children are introduced to statistics for the first time using visual representations of data. They are introduced […]
January 6, 2022

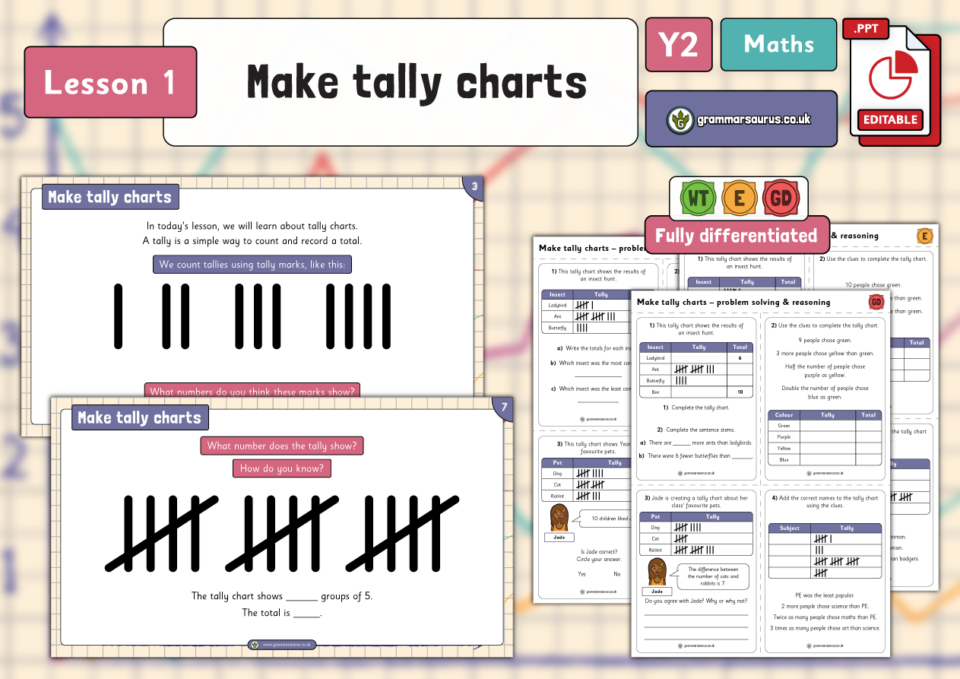
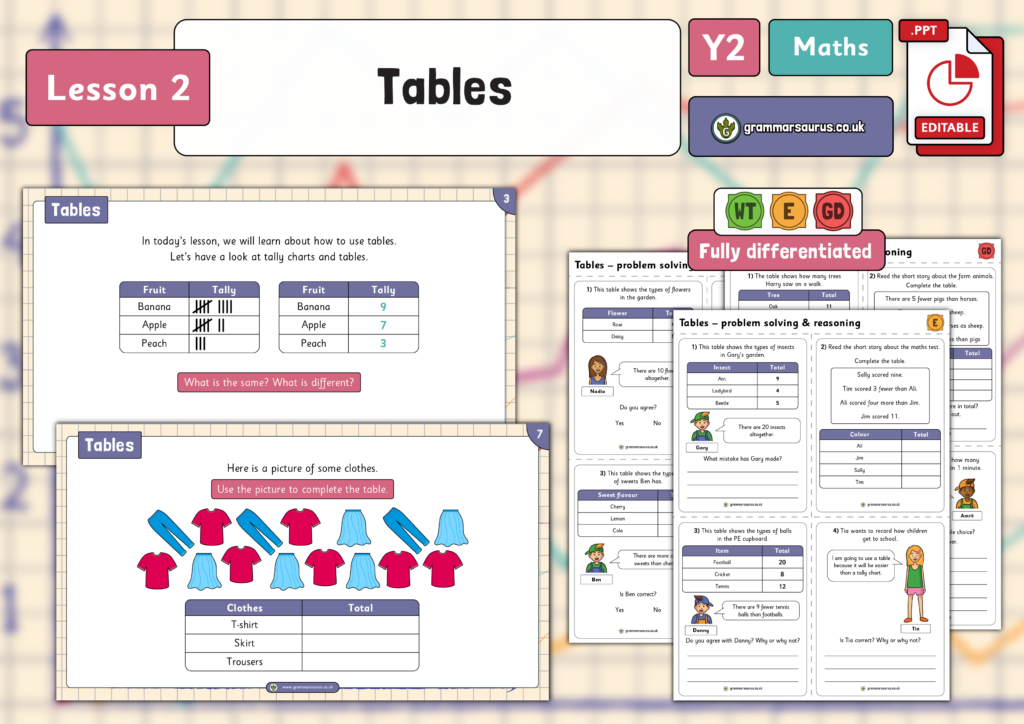
In this lesson, children will build on their previous learning of tally charts and use simple tables to represent data. […]
January 6, 2022

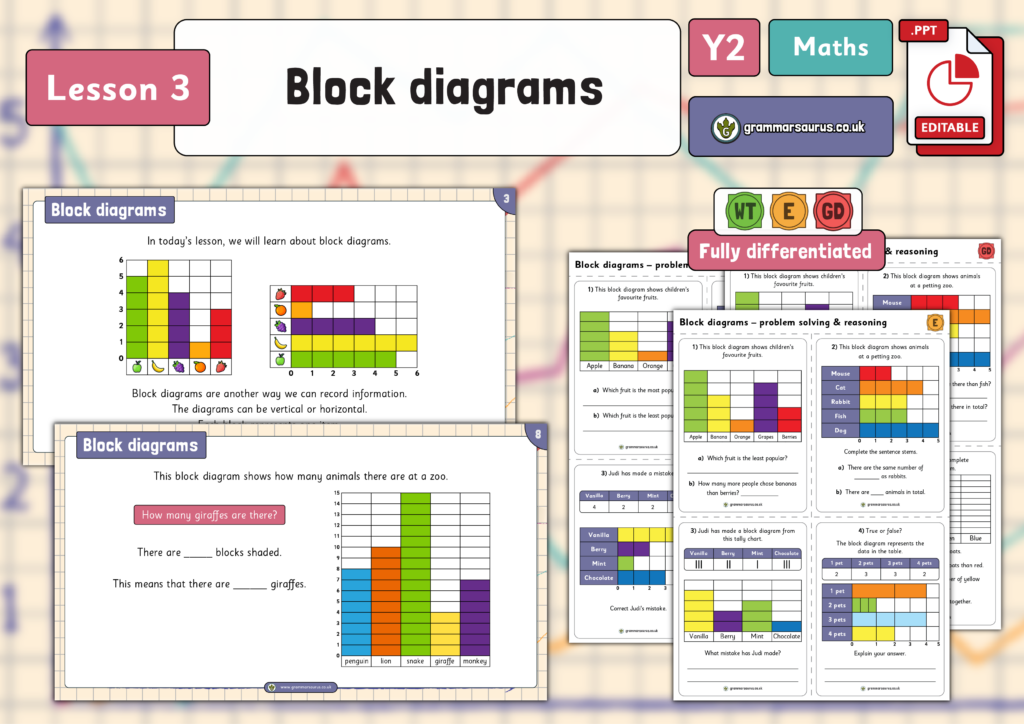
In this lesson, children are introduced to block diagrams as another form of representing data. This lesson focusses on using […]
January 6, 2022

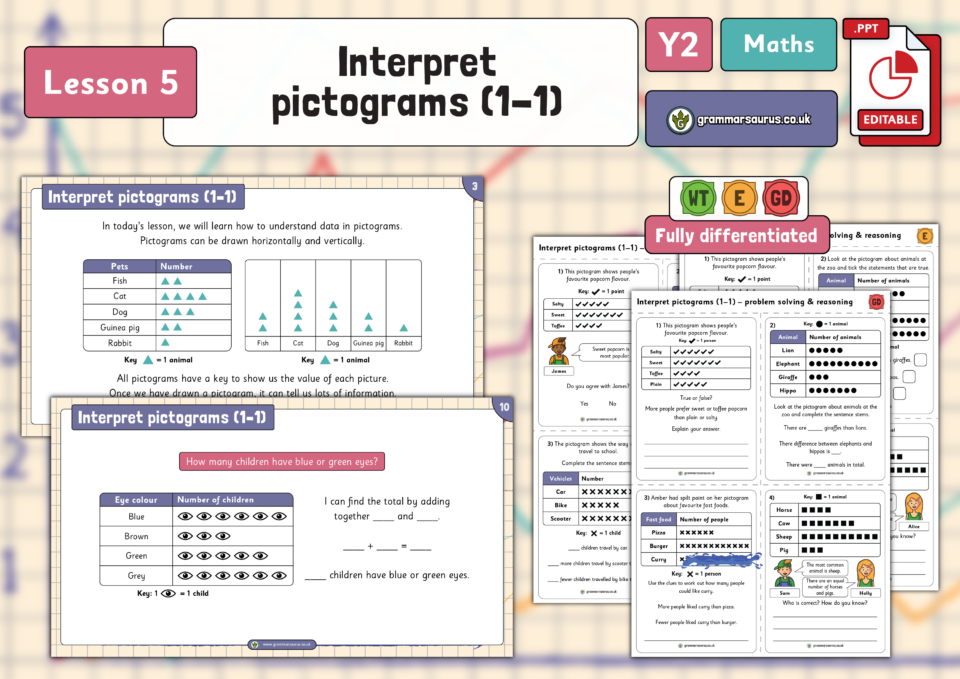
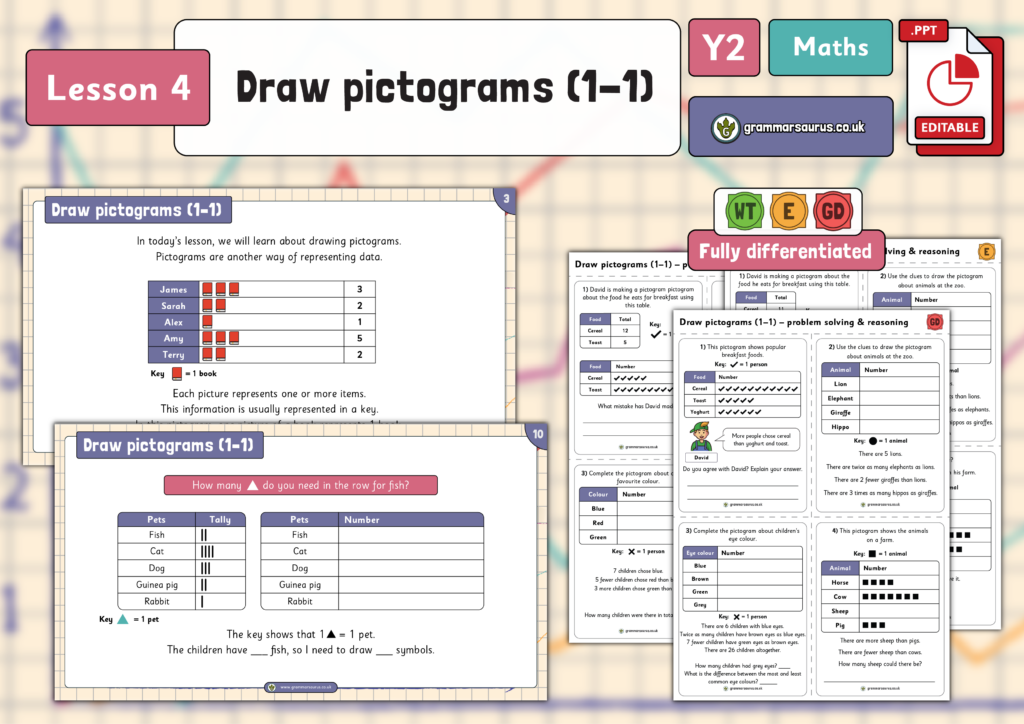
In this lesson, children are introduced to pictograms as another way of representing data. They begin by focussing on pictograms […]
January 6, 2022
In this lesson, children build on prior knowledge of comparing and ordering unit fractions to comparing and ordering non-unit fractions, […]
December 31, 2020
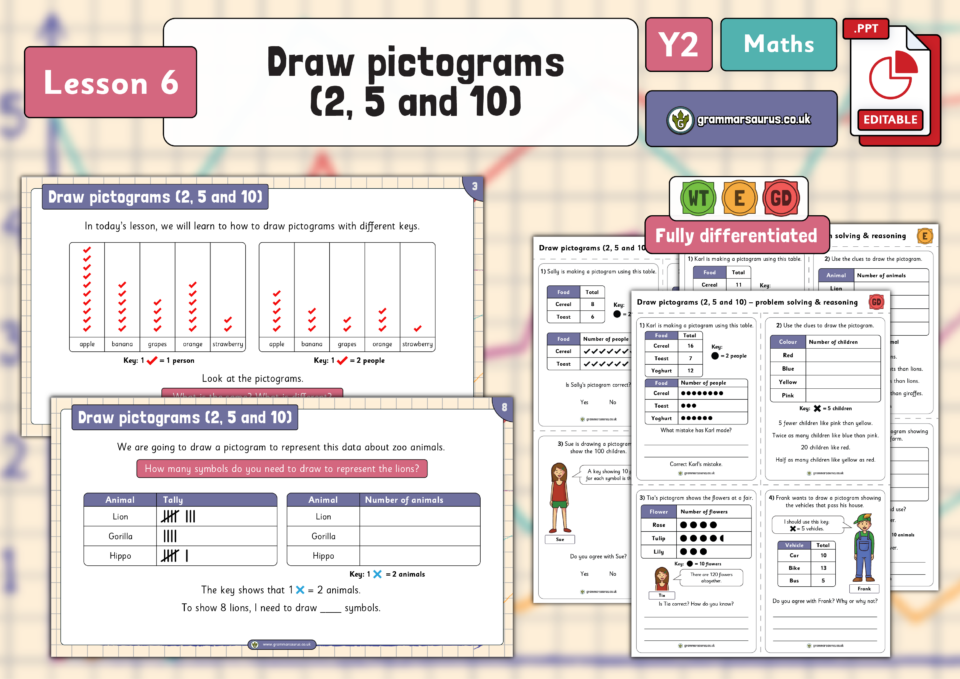
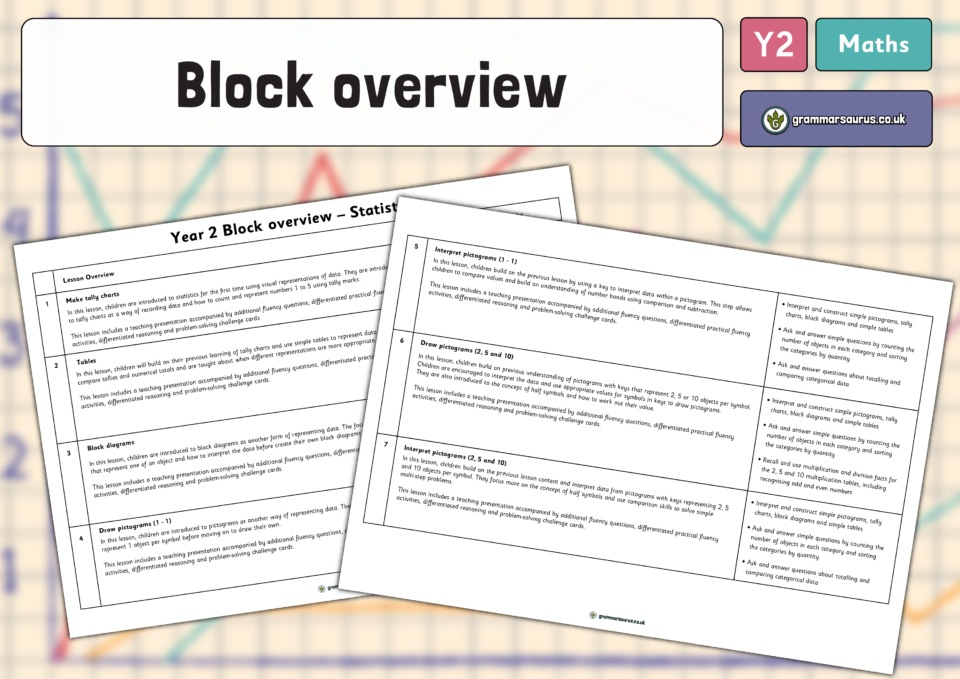
In this lesson, children build on previous understanding of pictograms with keys that represent 2, 5 or 10 objects per […]
December 31, 2020
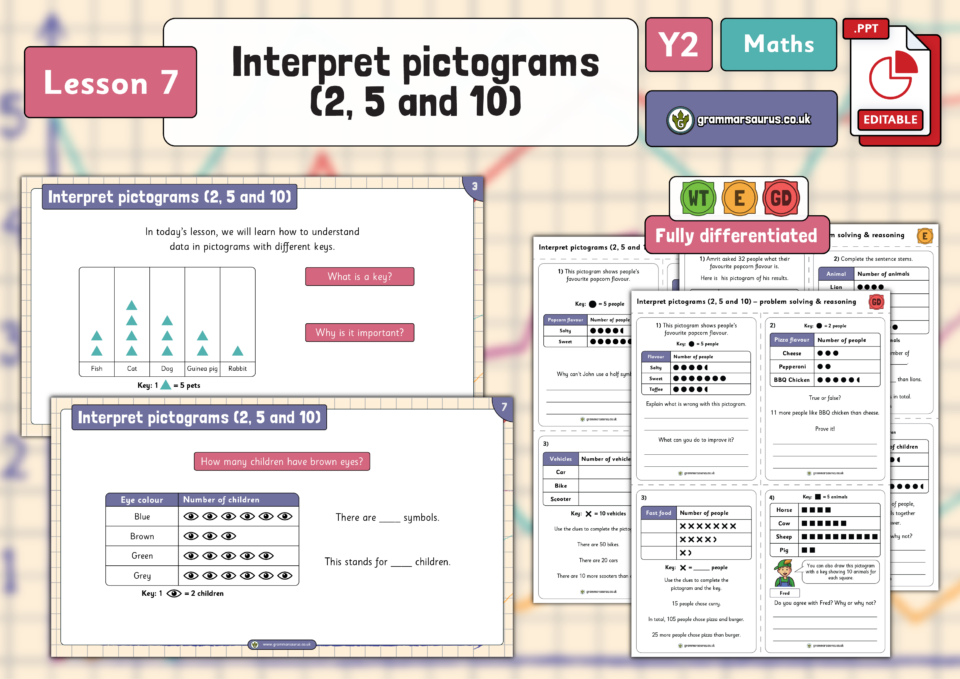
In this lesson, children build on the previous lesson content and interpret data from pictograms with keys representing 2, 5 […]
December 30, 2020
... Hello, Downloads are for members of Grammarsaurus only. Please sign up below or login if you are already a […]
December 30, 2020
... Hello, Downloads are for members of Grammarsaurus only. Please sign up below or login if you are already a […]