Solo sign up
 School sign up
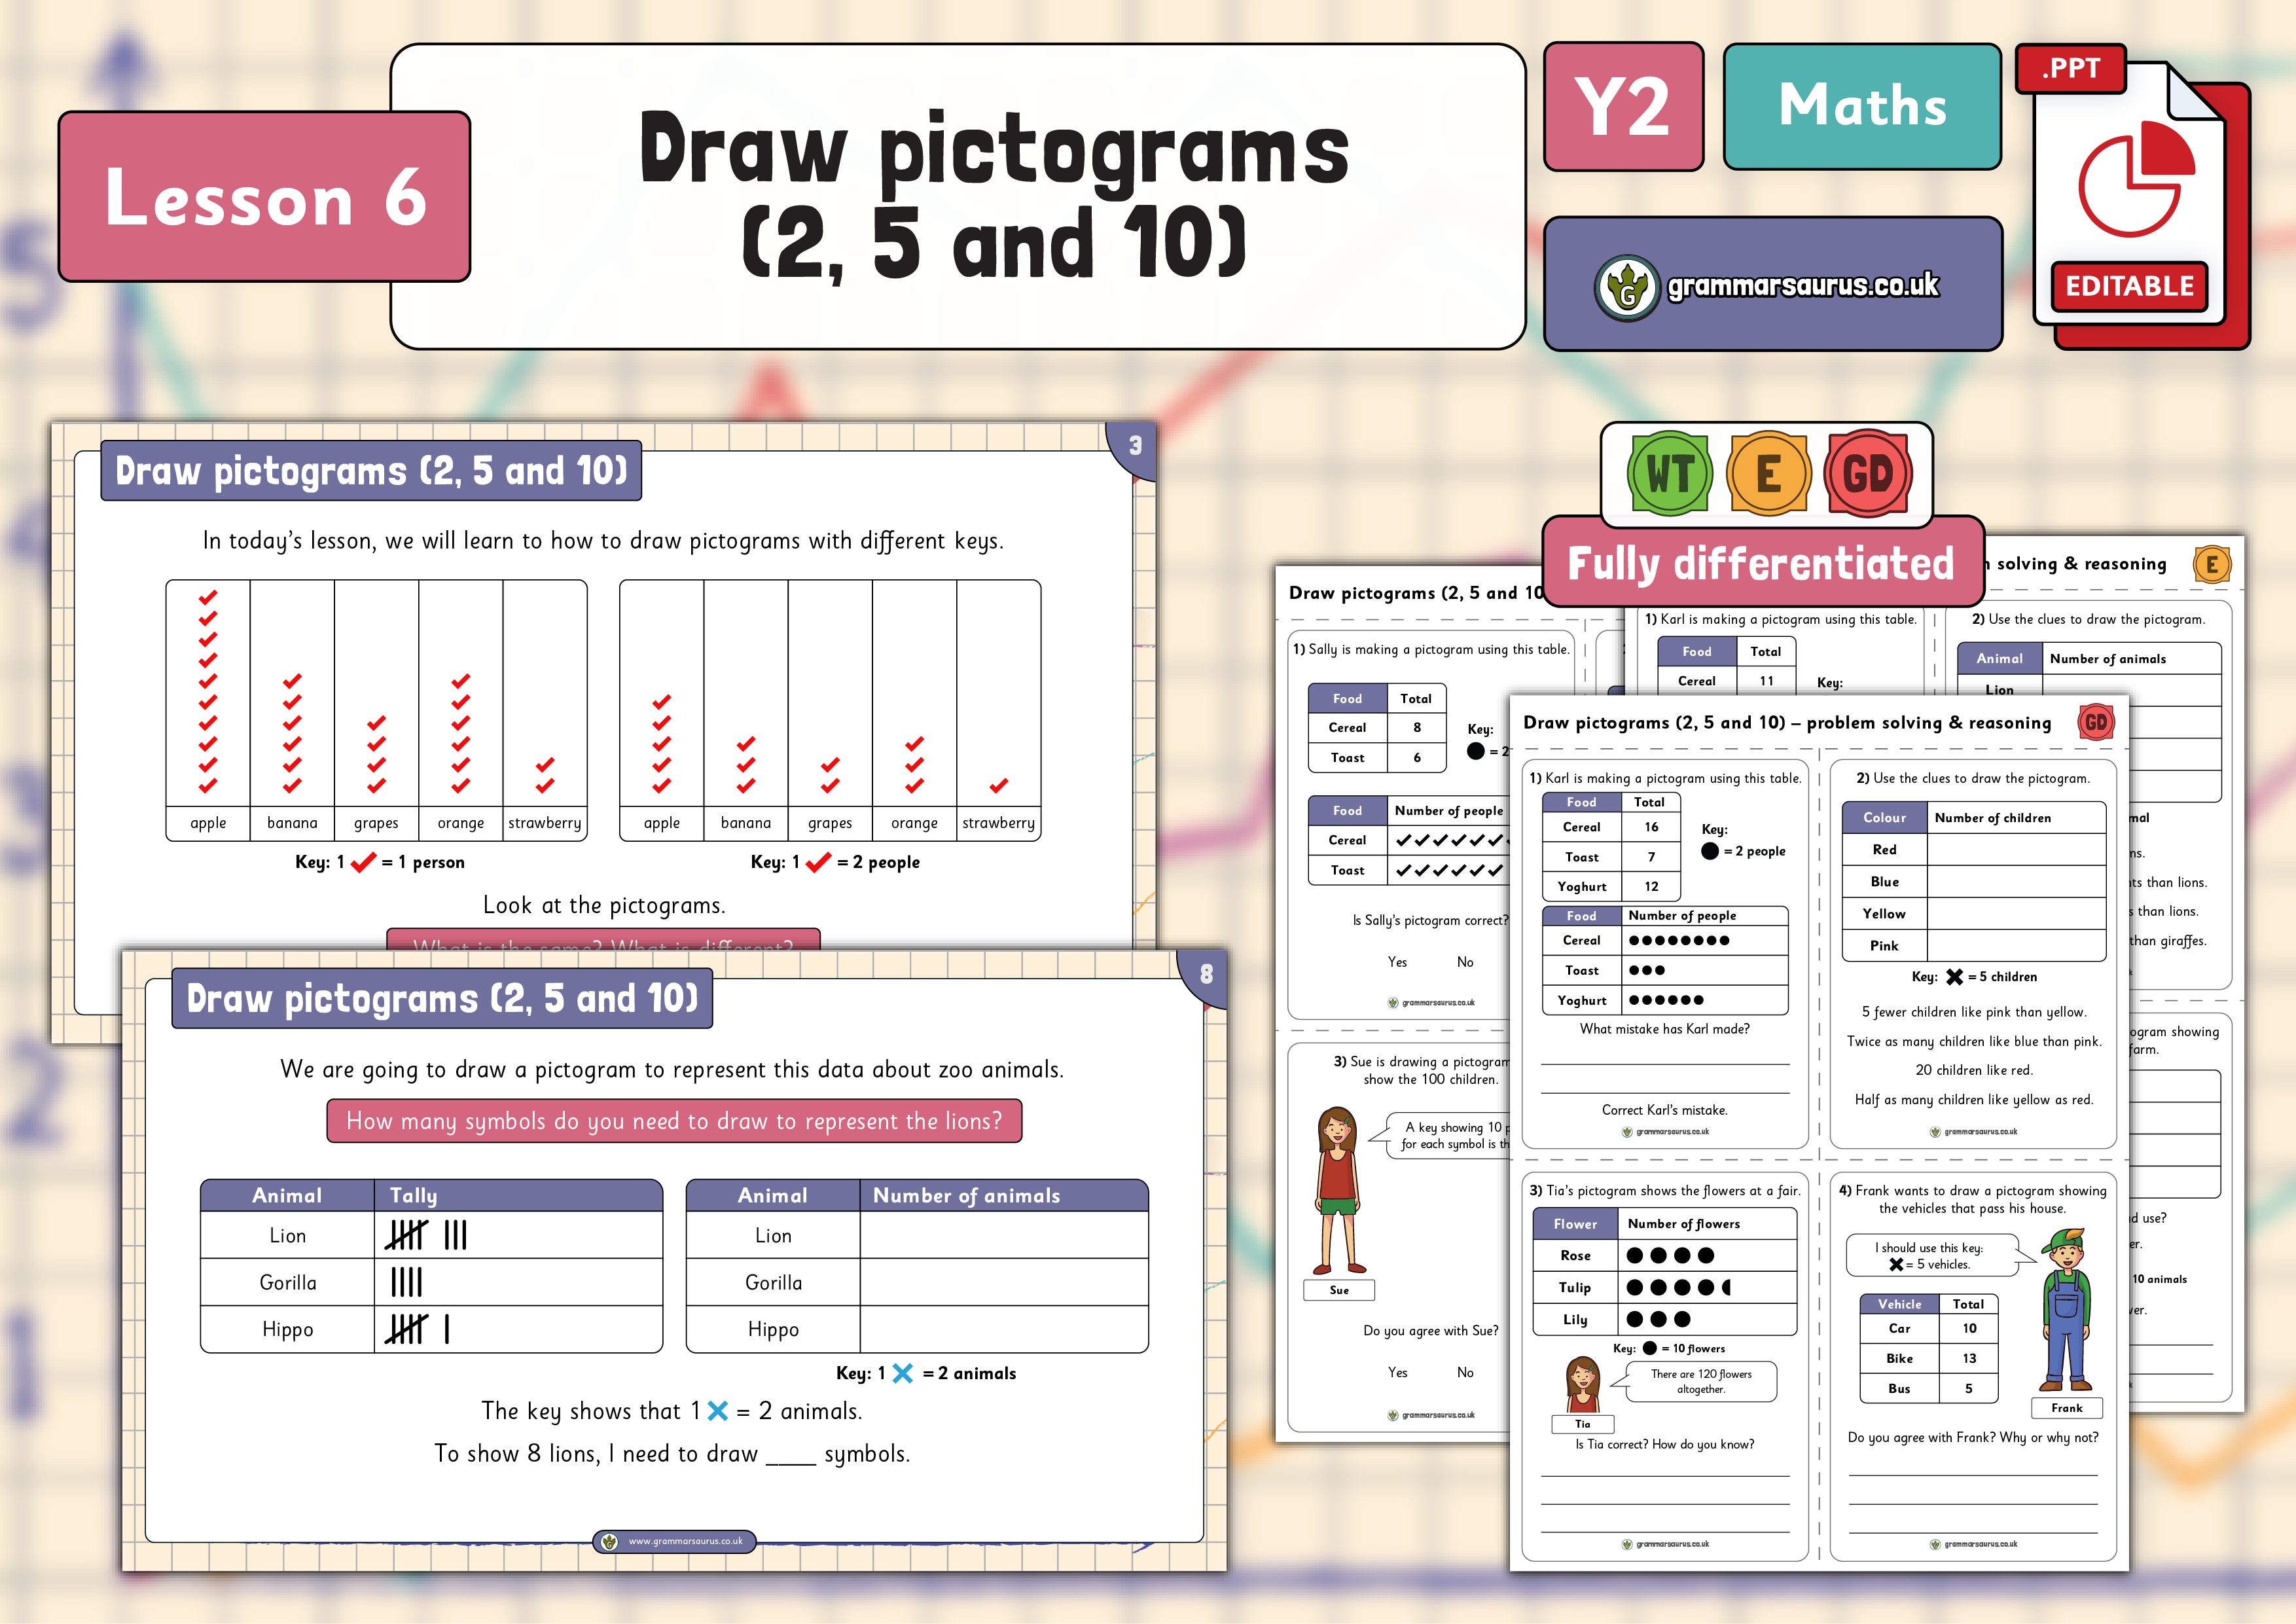
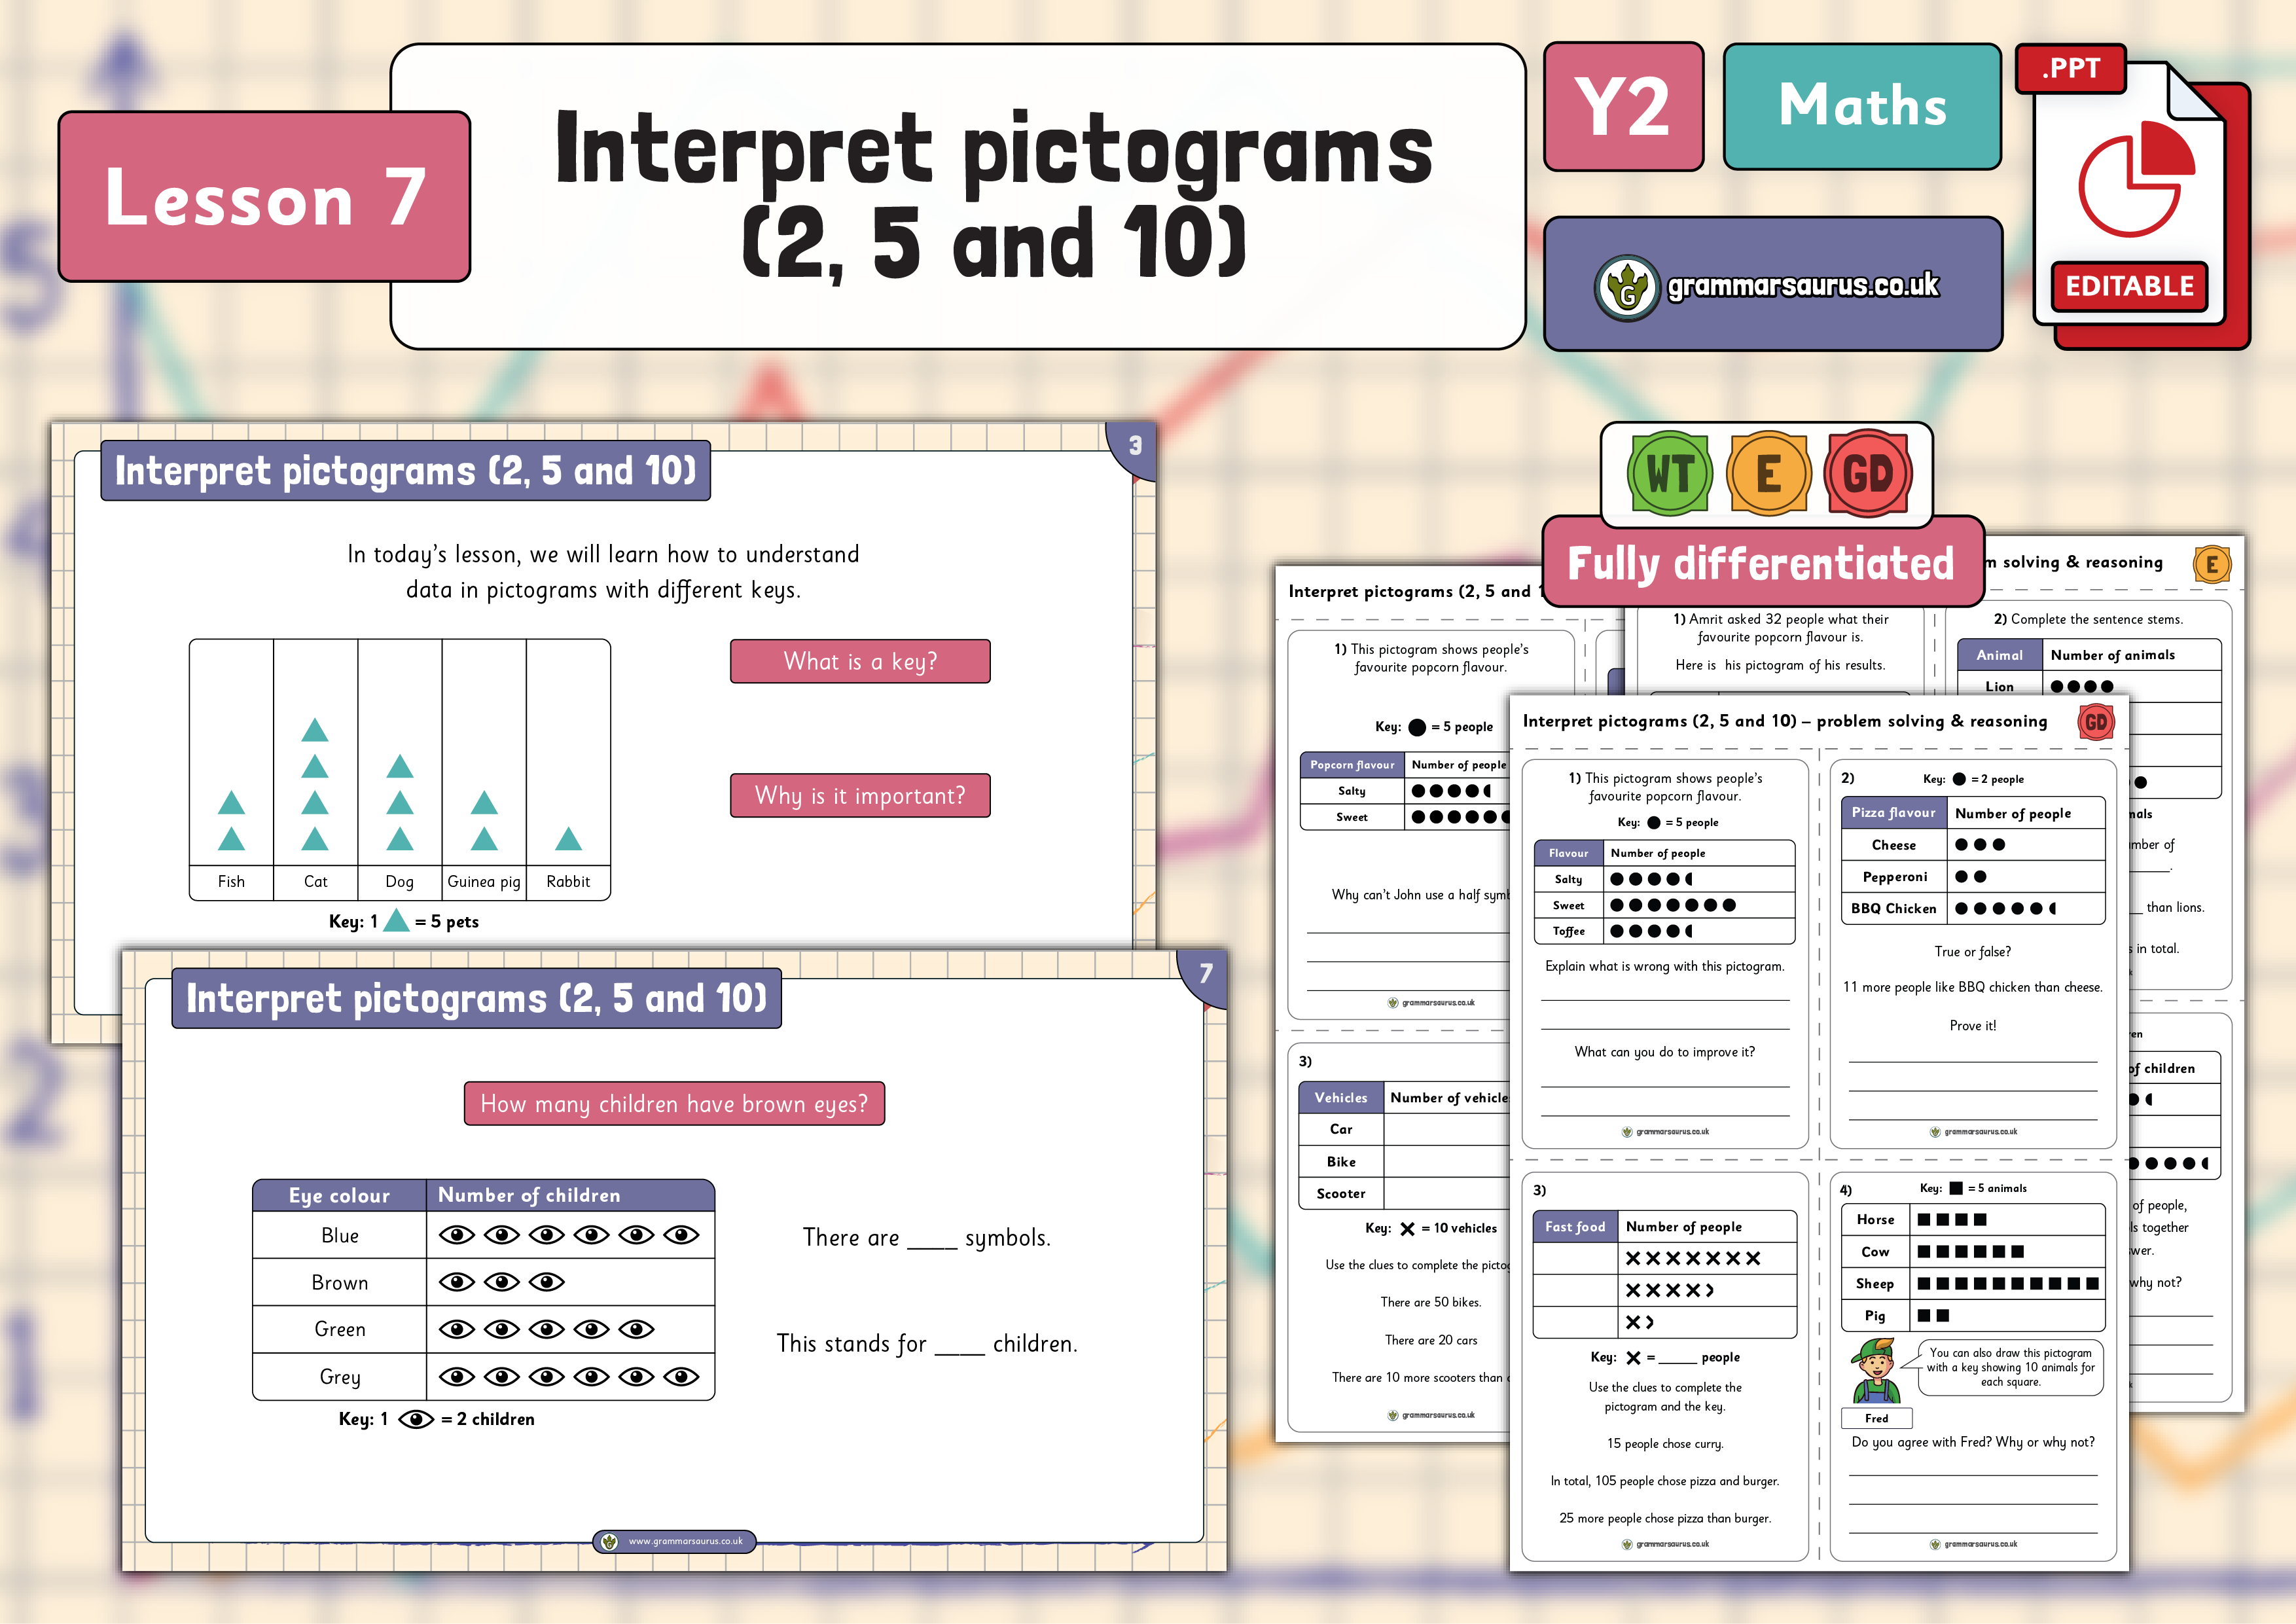
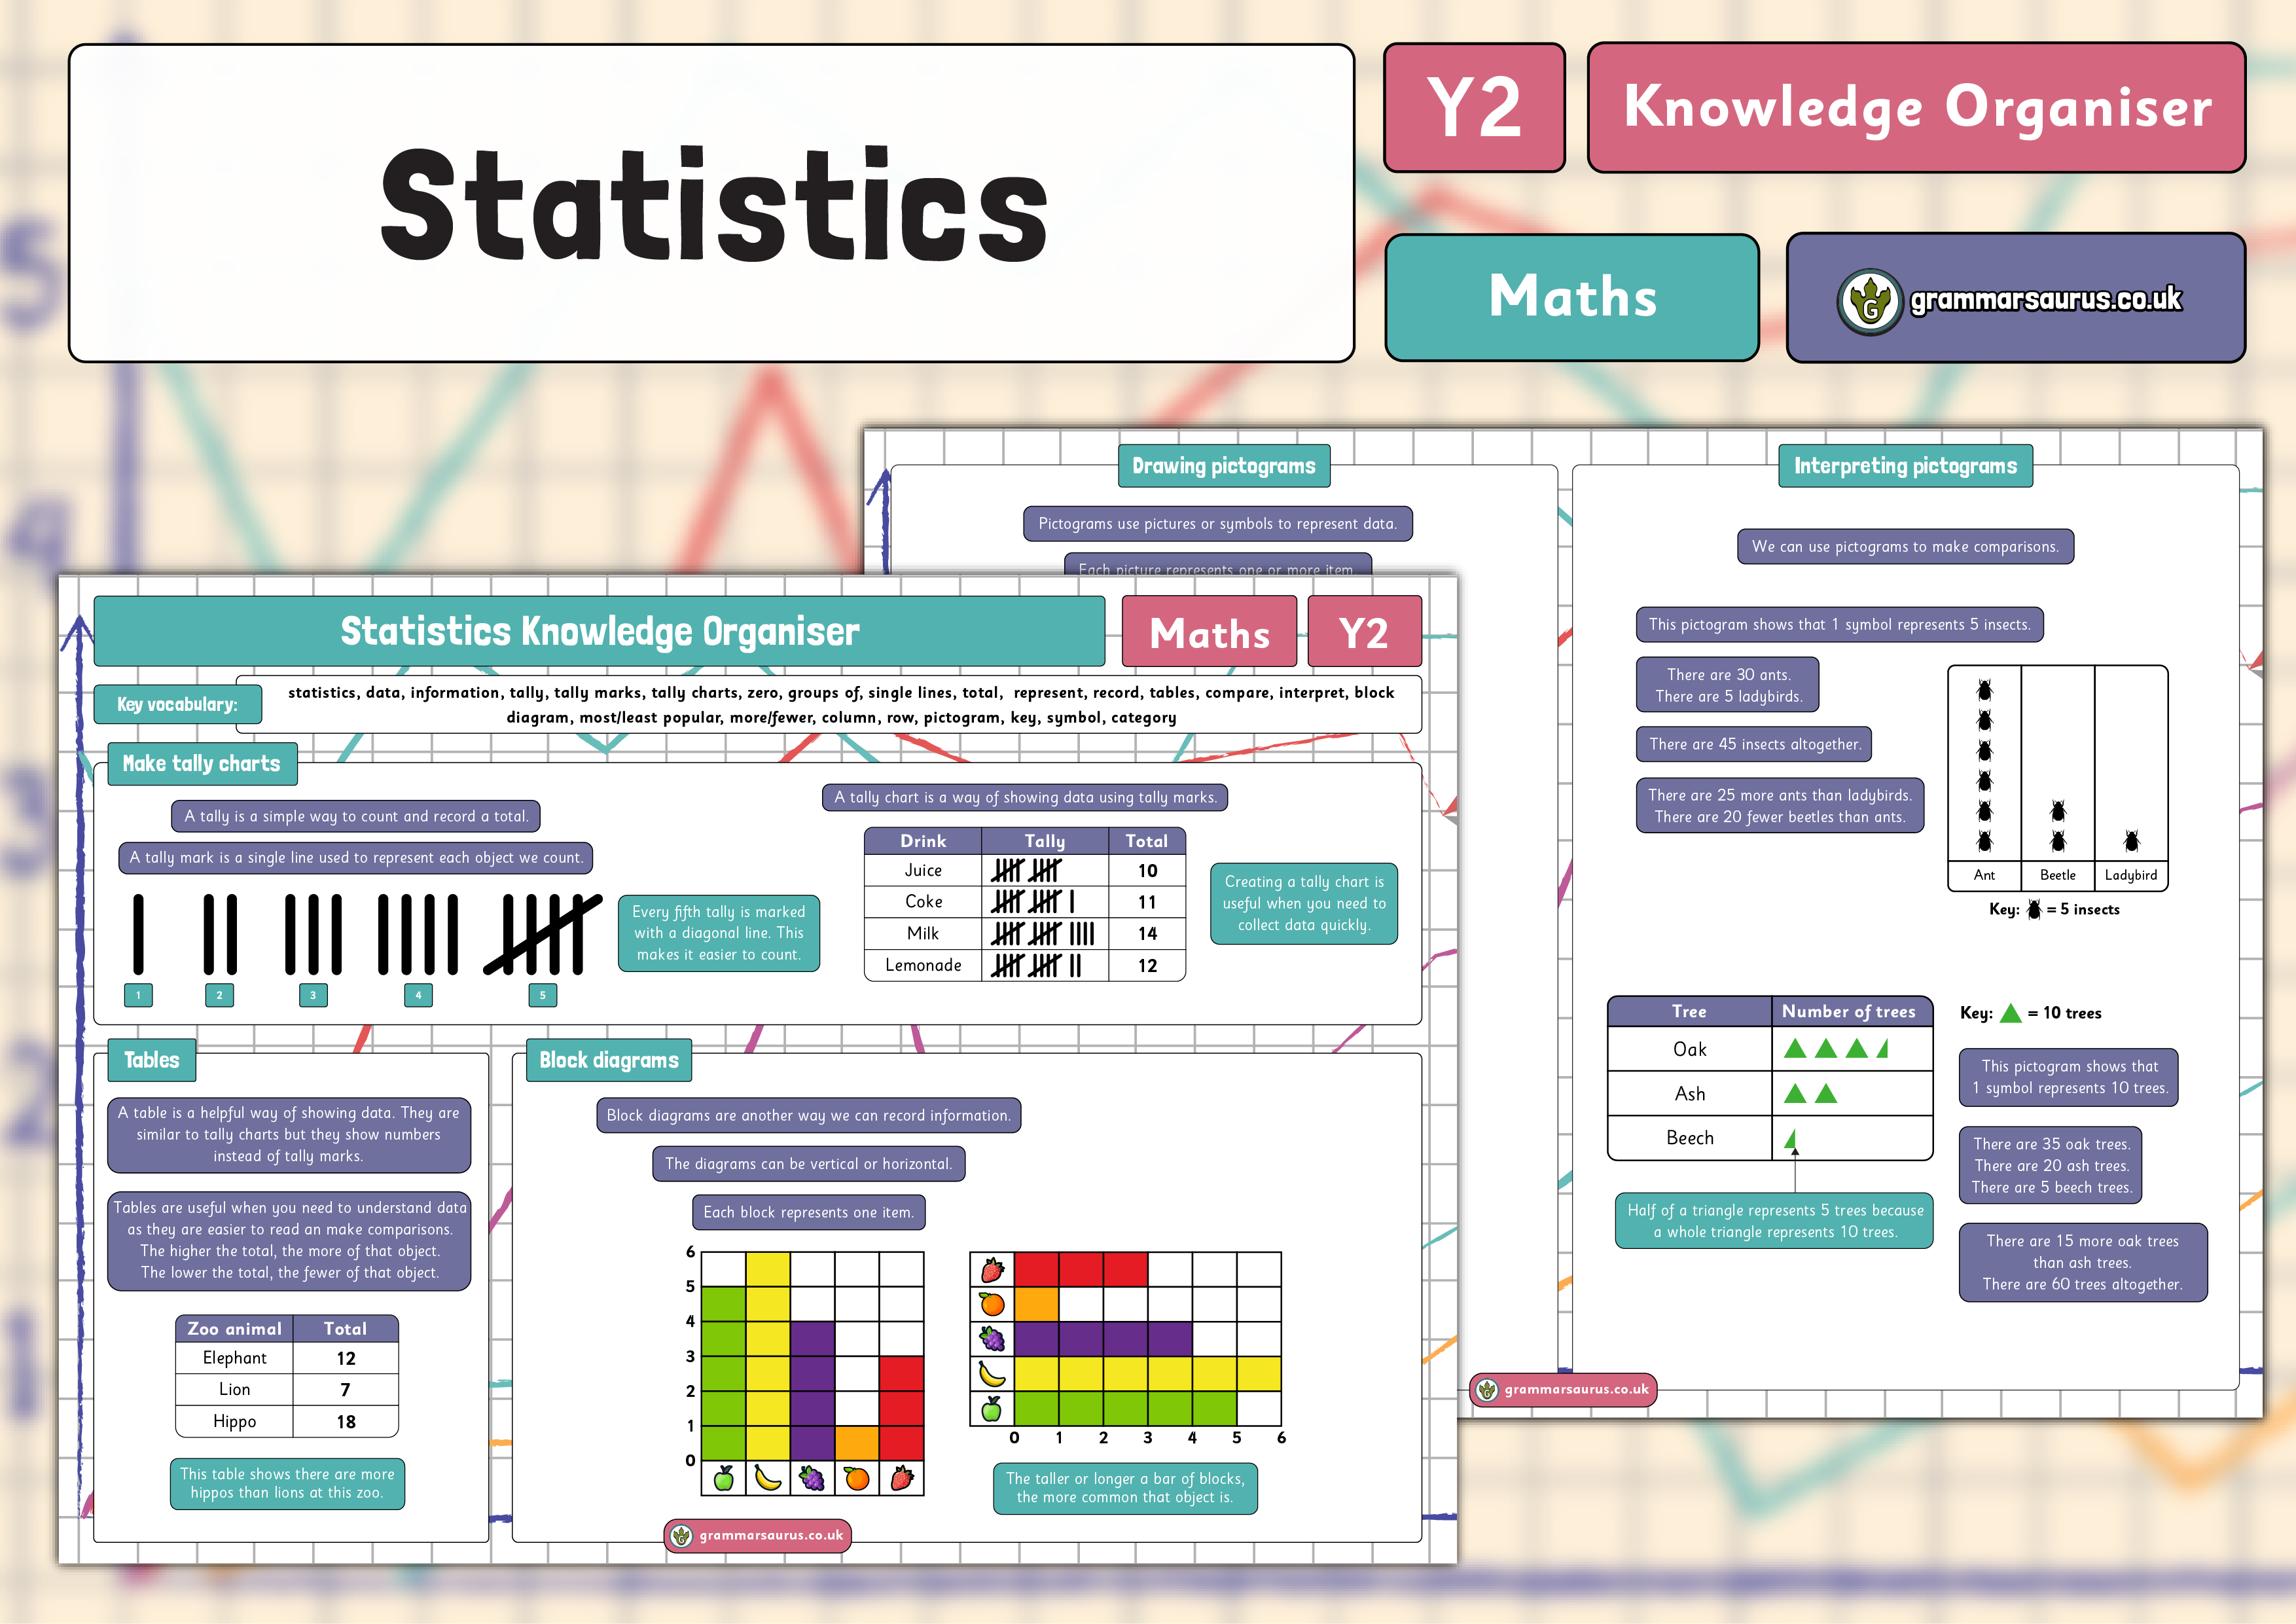
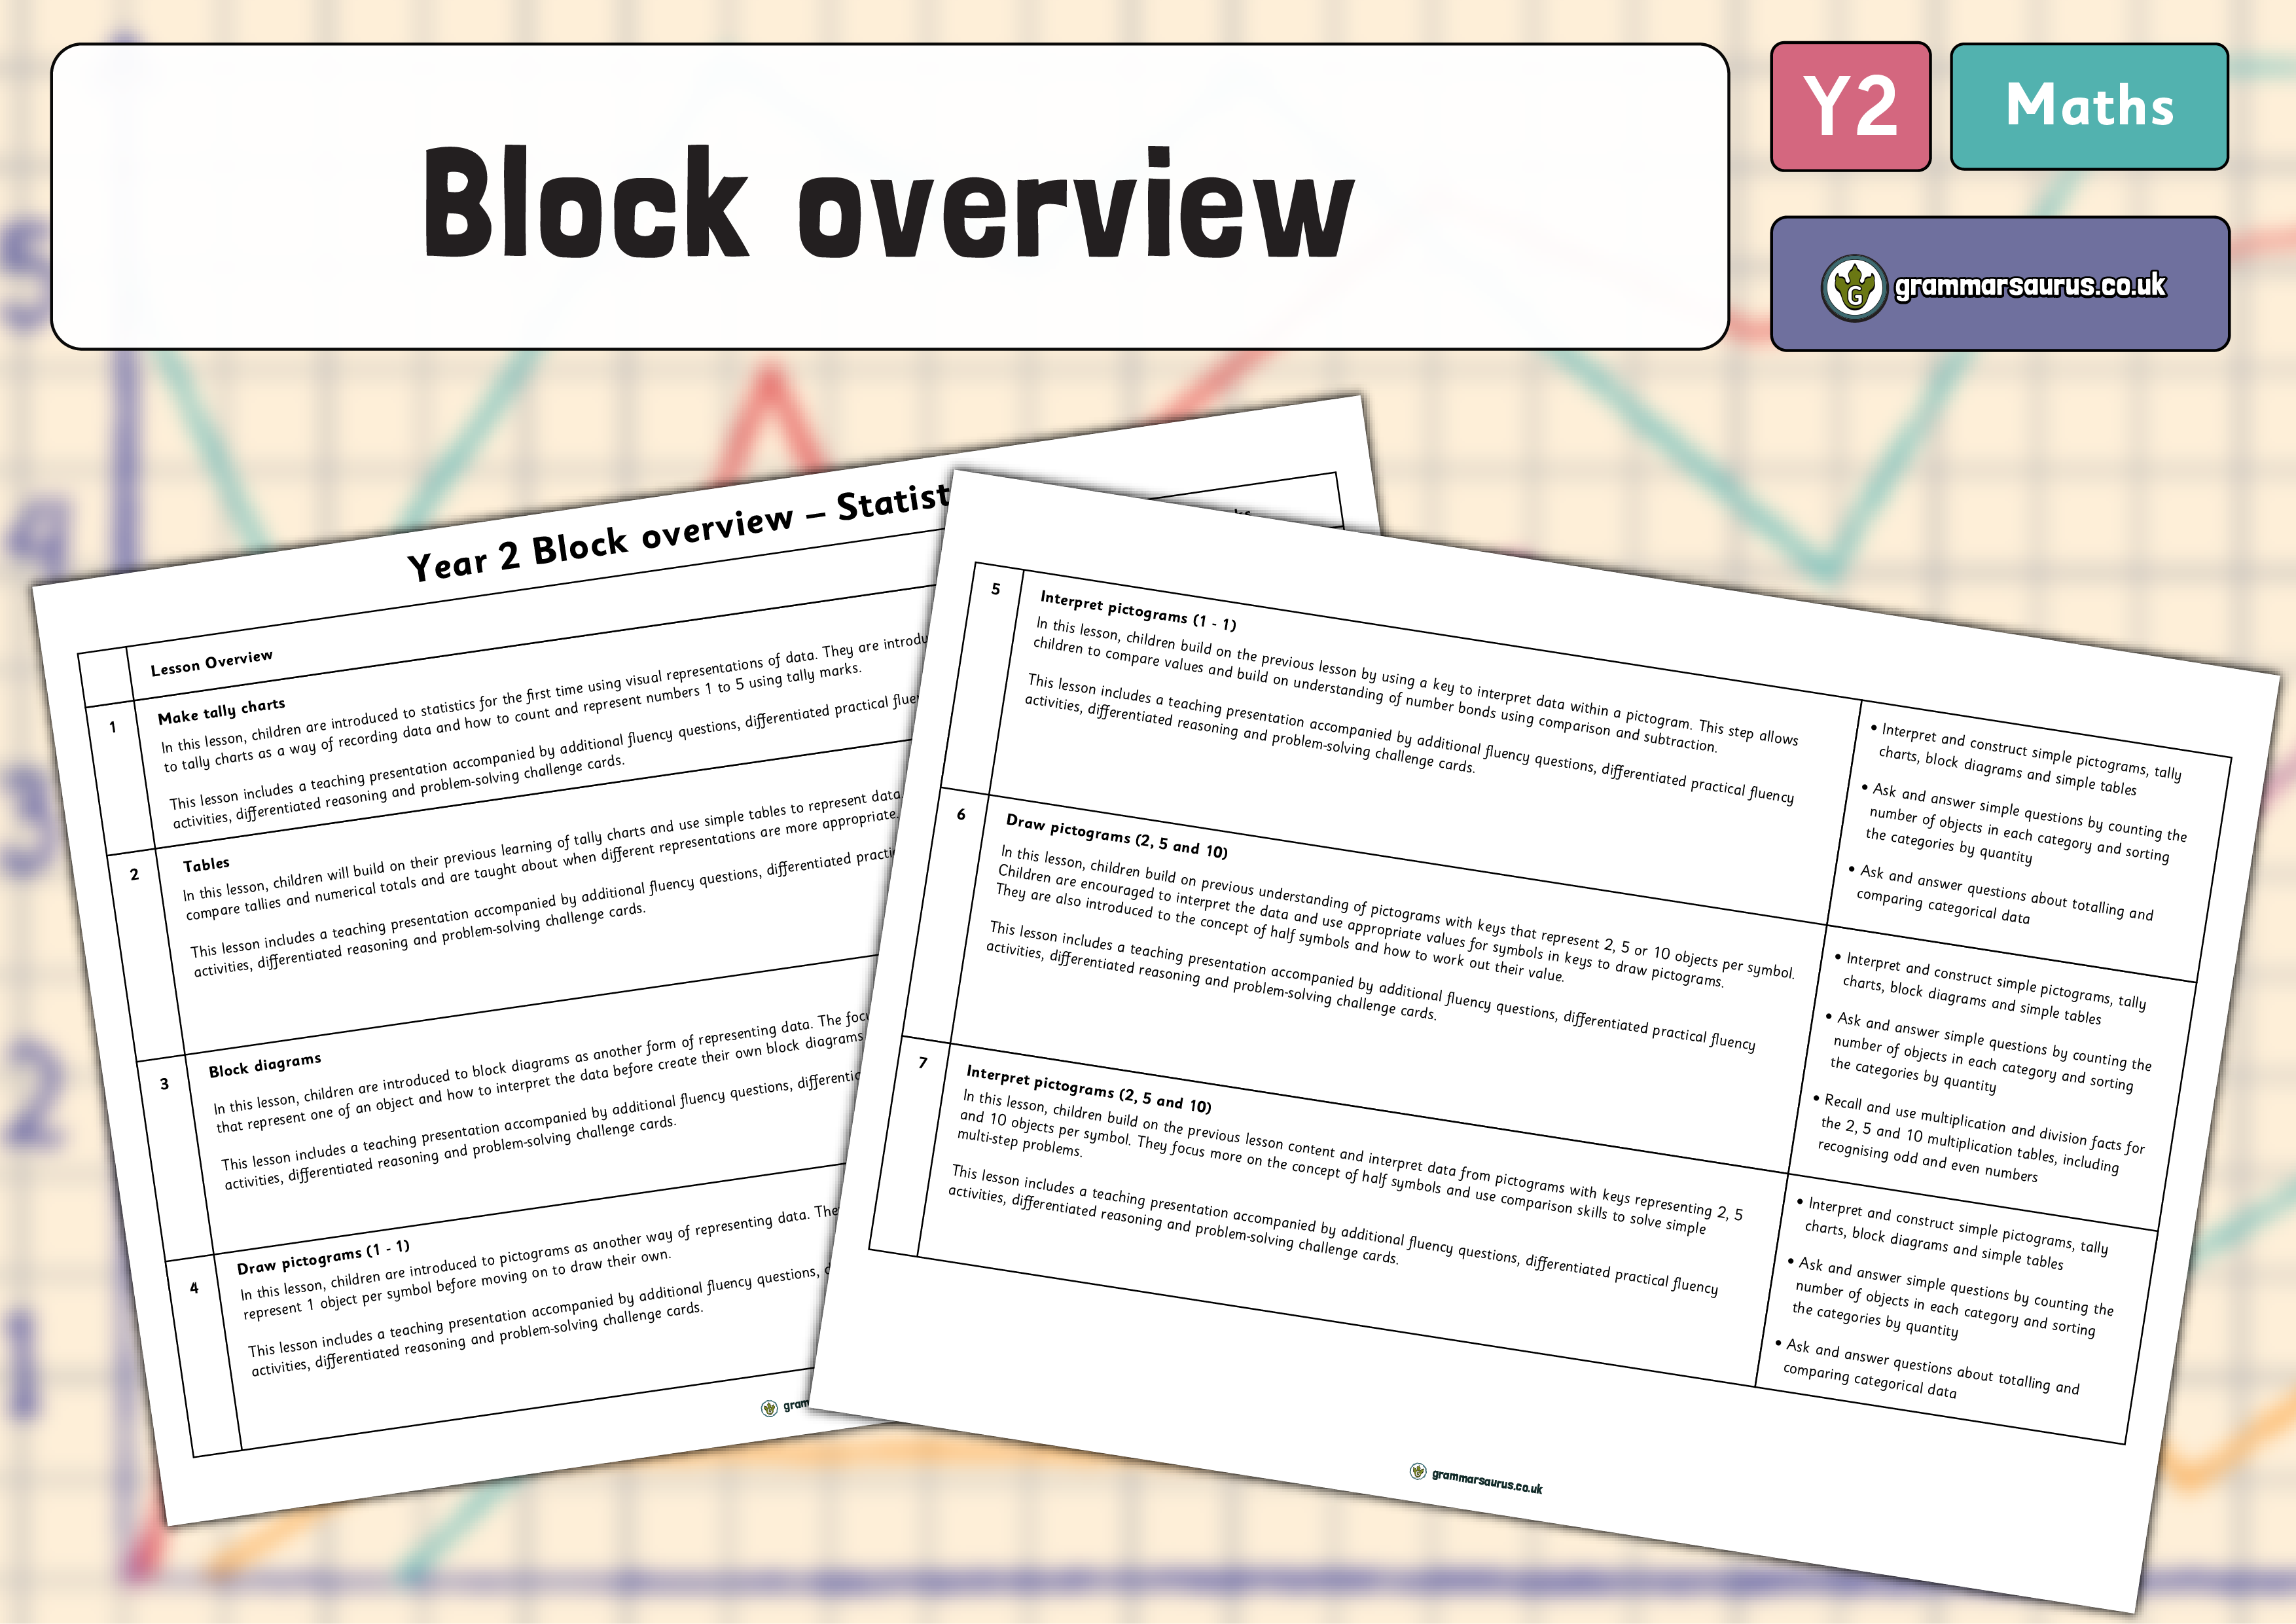
Year 2 Statistics – Block diagrams – Lesson 3
Year 2 Statistics – Block diagrams – Lesson 3
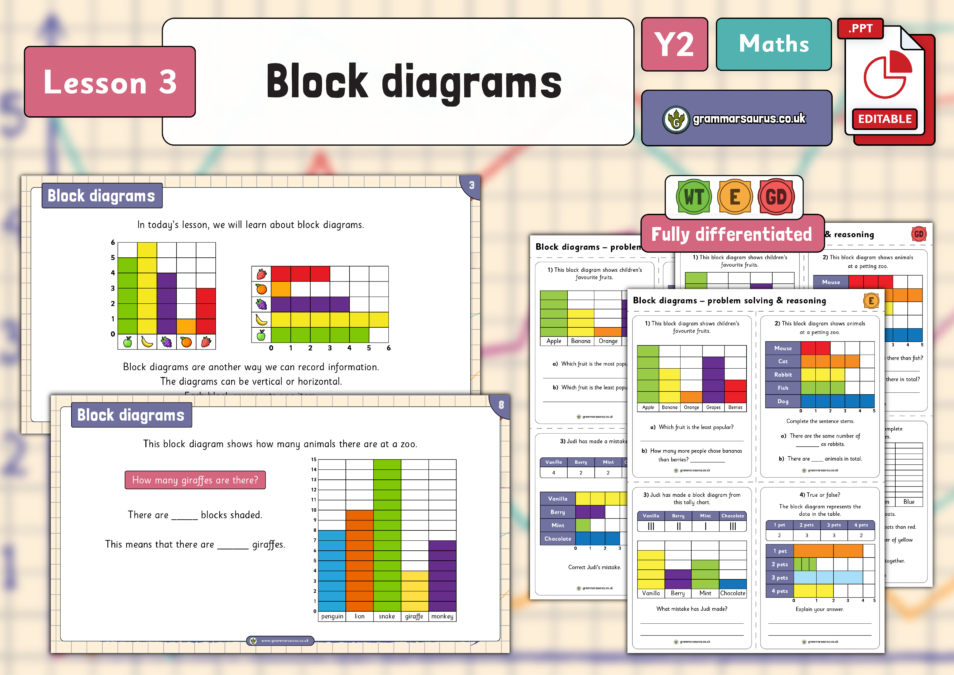
In this lesson, children are introduced to block diagrams as another form of representing data. The focus is on using blocks that represent one of an object and how to interpret the data before create their own block diagrams to represent data. This lesson includes a teaching presentation accompanied by additional fluency questions, differentiated practical fluency activities, differentiated reasoning and problem-solving challenge cards. National Curriculum objectives:Mathematics Year 2:
Interpret and construct simple pictograms, tally charts, block diagrams and simple tables Ask and answer simple questions by counting the number of objects in each category and sorting the categories by quantity Ask and answer questions about totalling and comparing categorical data
Levels of this pack:Age: 6-7#Summer Block 3...
Hello,
Downloads are for members of Grammarsaurus only.
Please sign up below or login if you are already a member.
Hi! Sign in Or Solo sign up Or School sign up