Year 4 Statistics – Draw line graphs – Lesson 4
Year 4 Statistics – Draw line graphs – Lesson 4
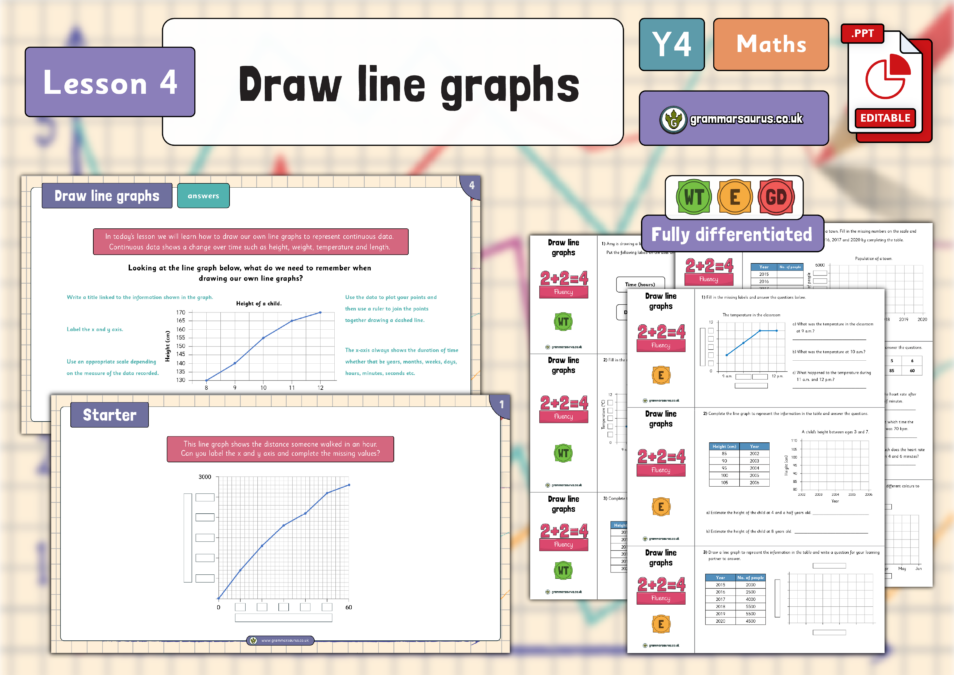
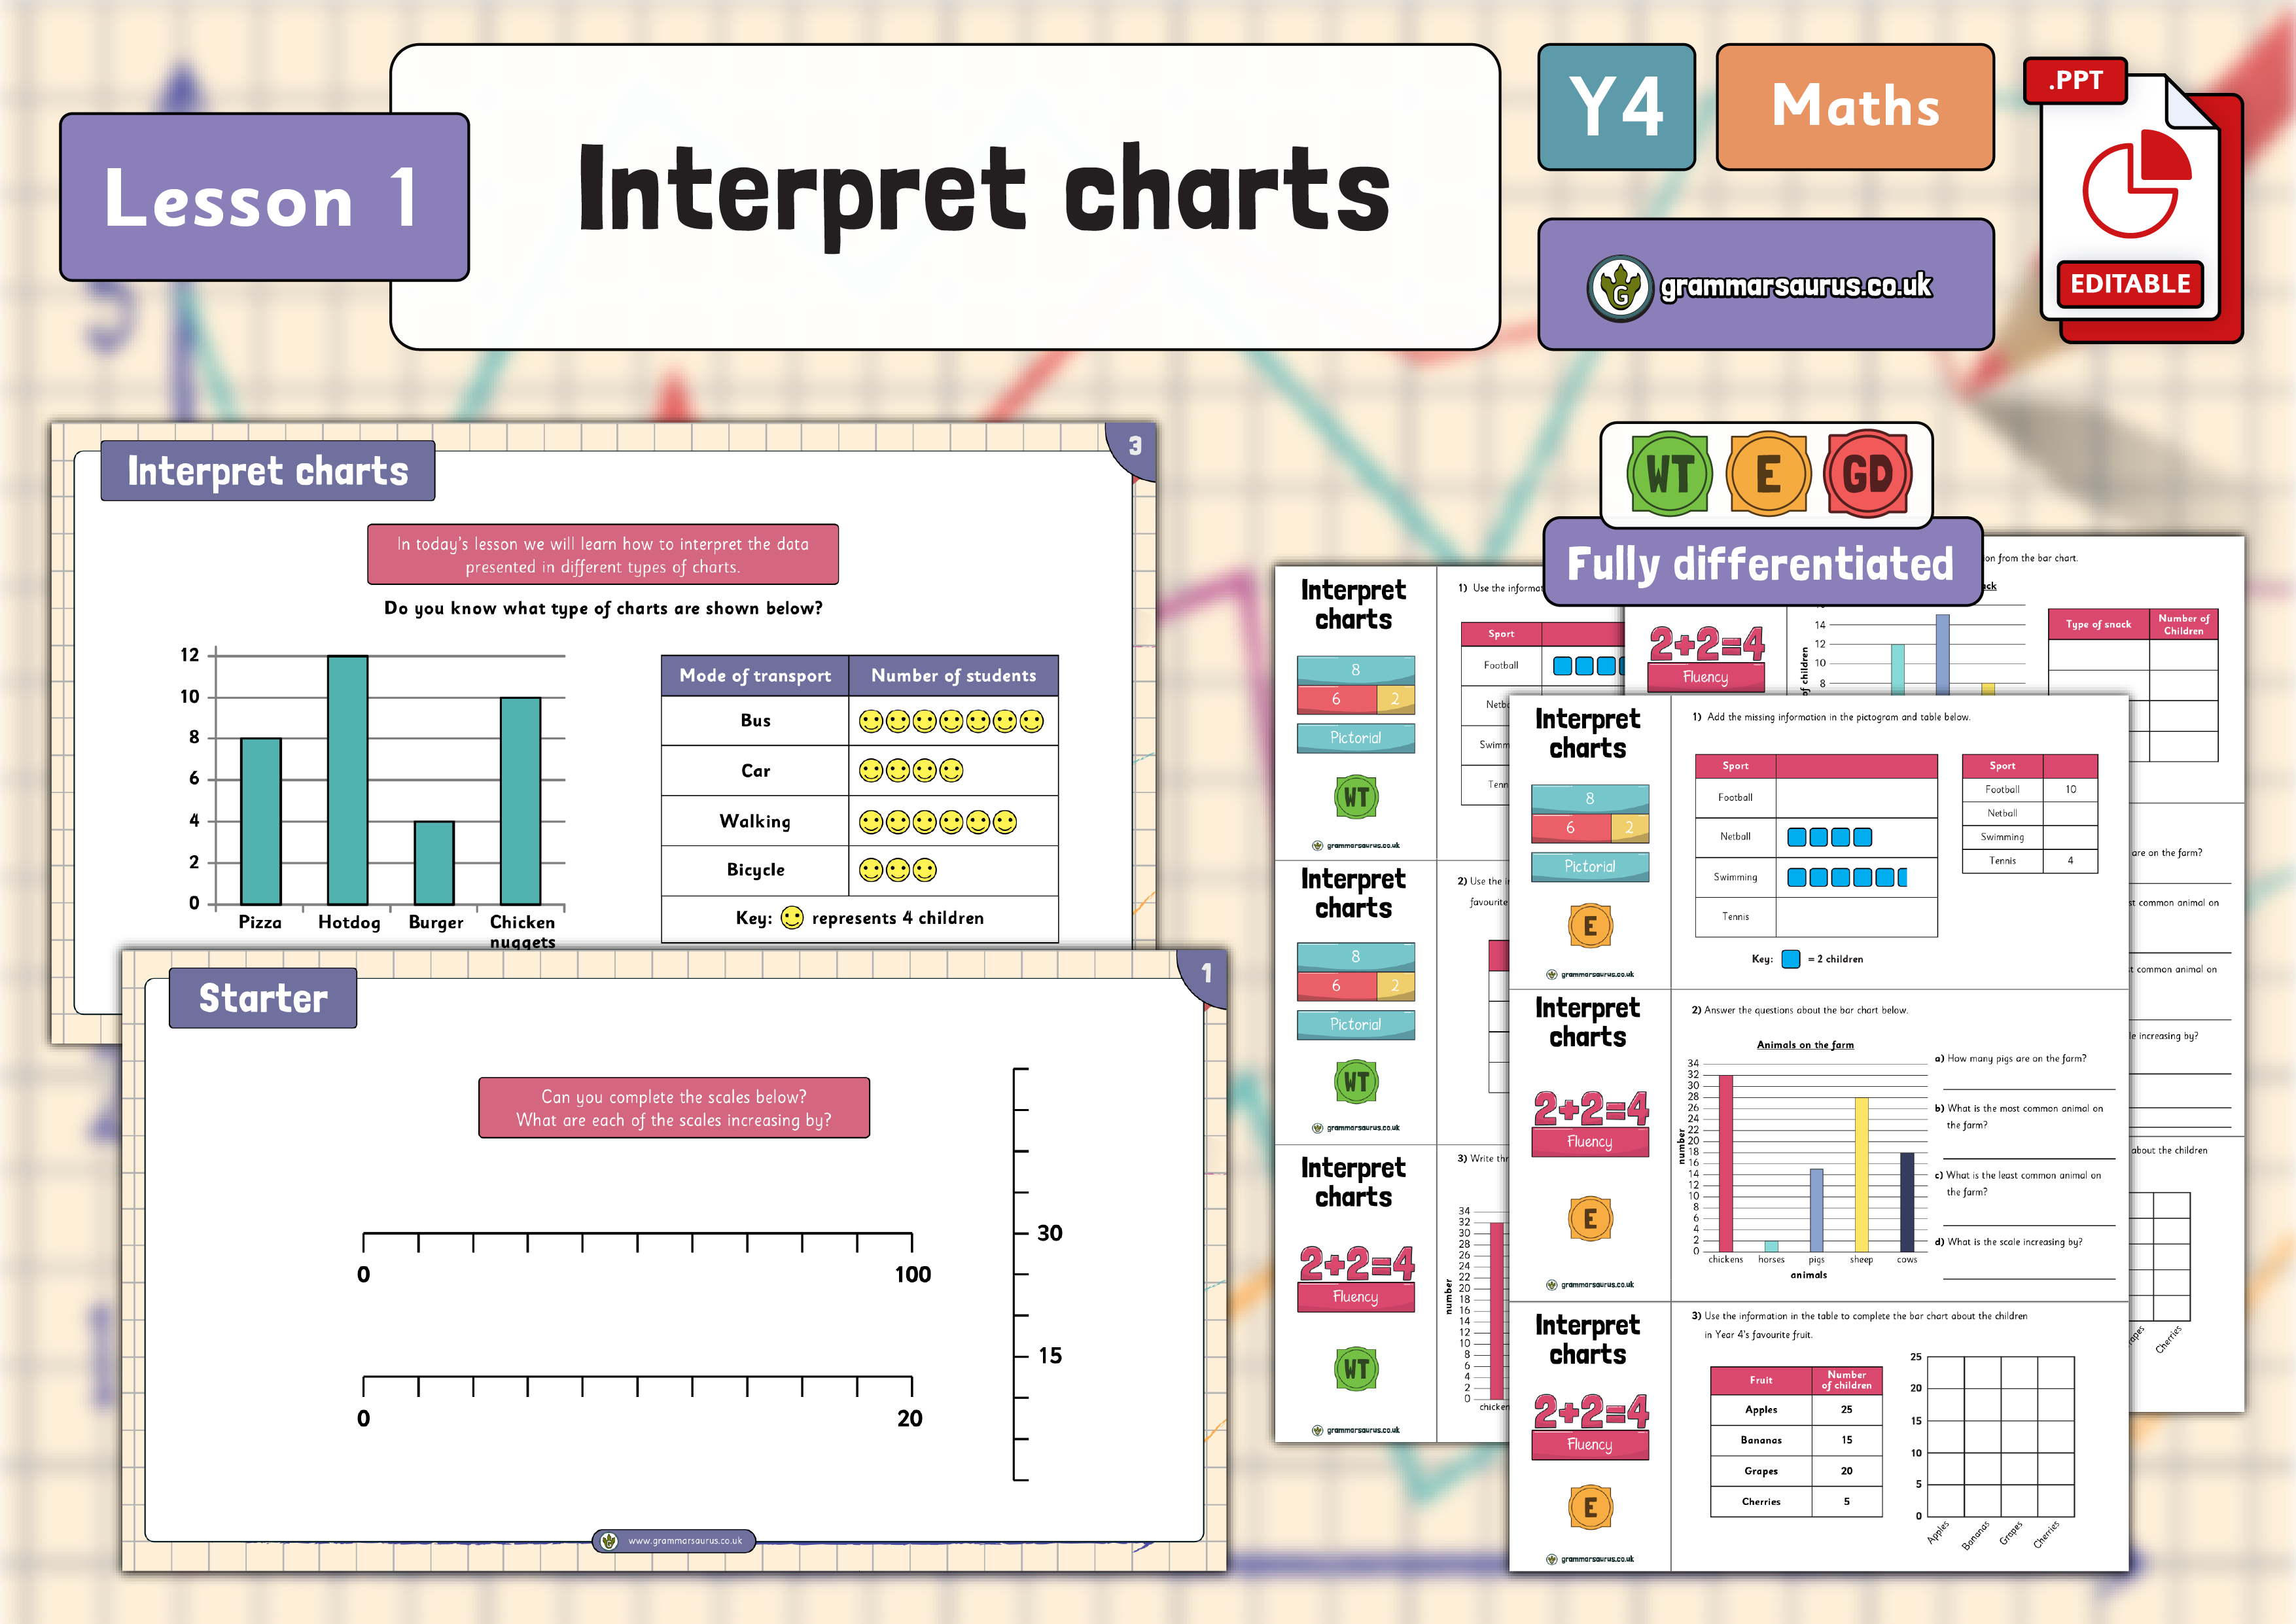
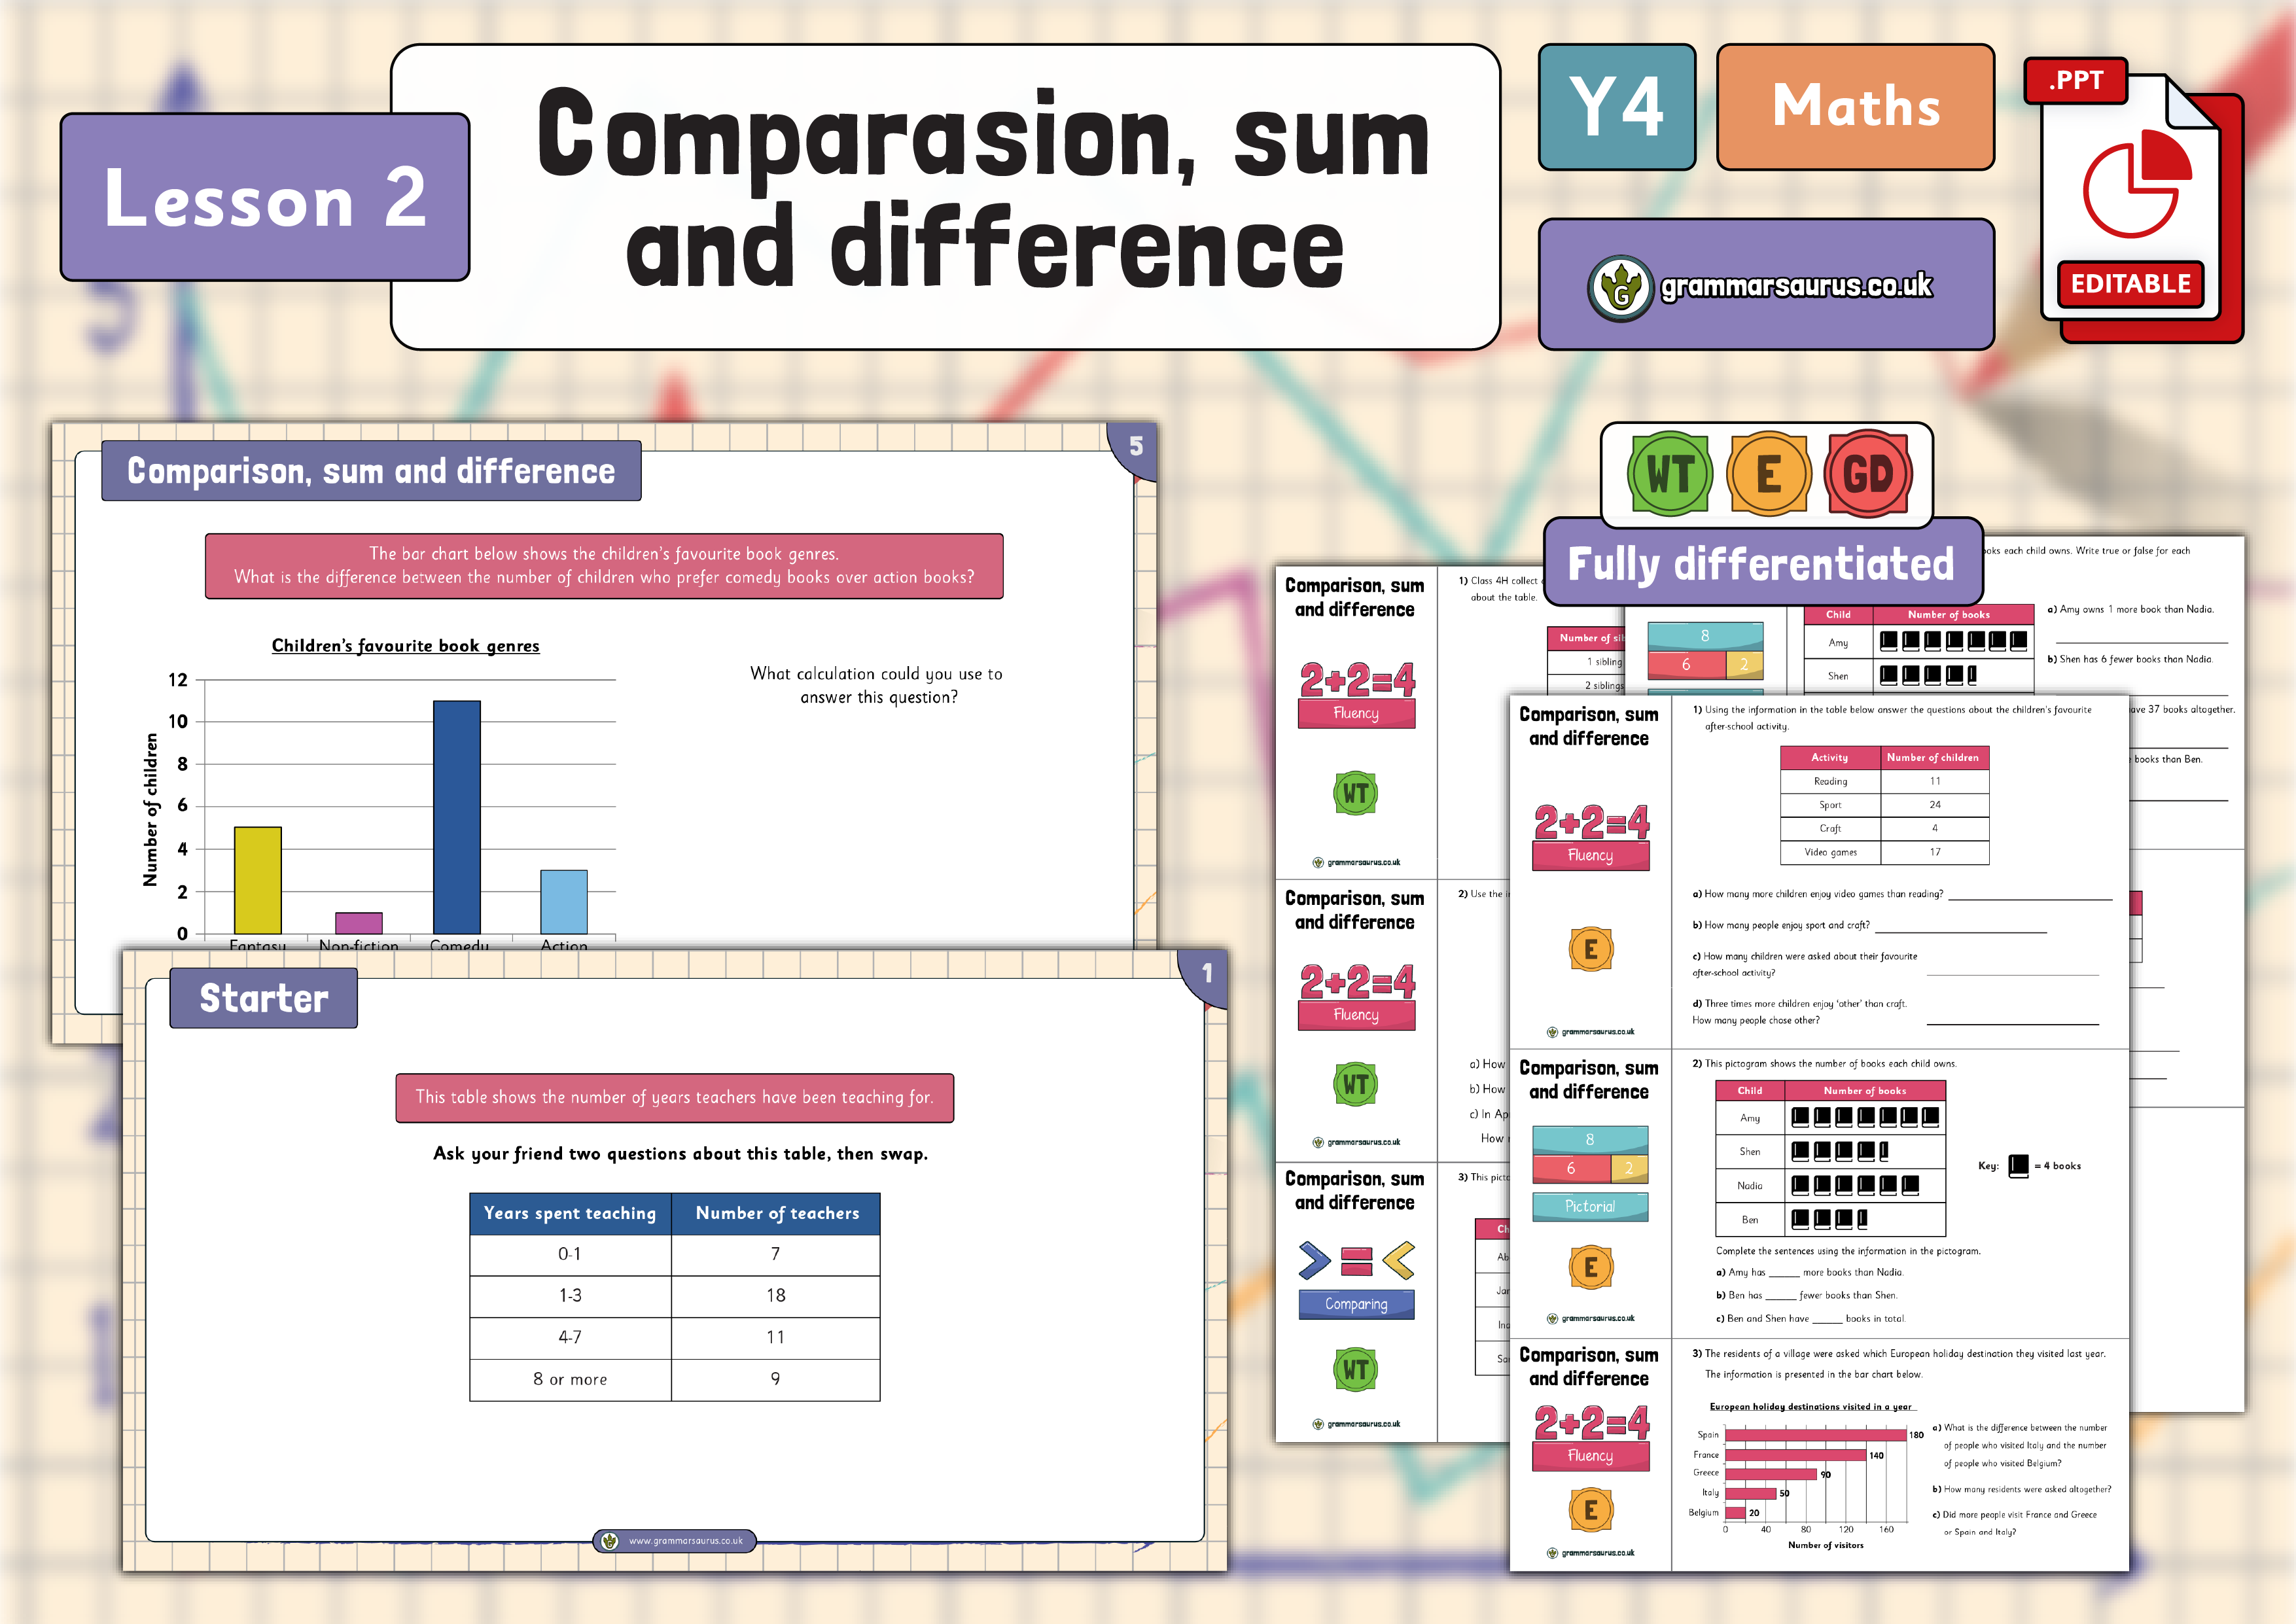
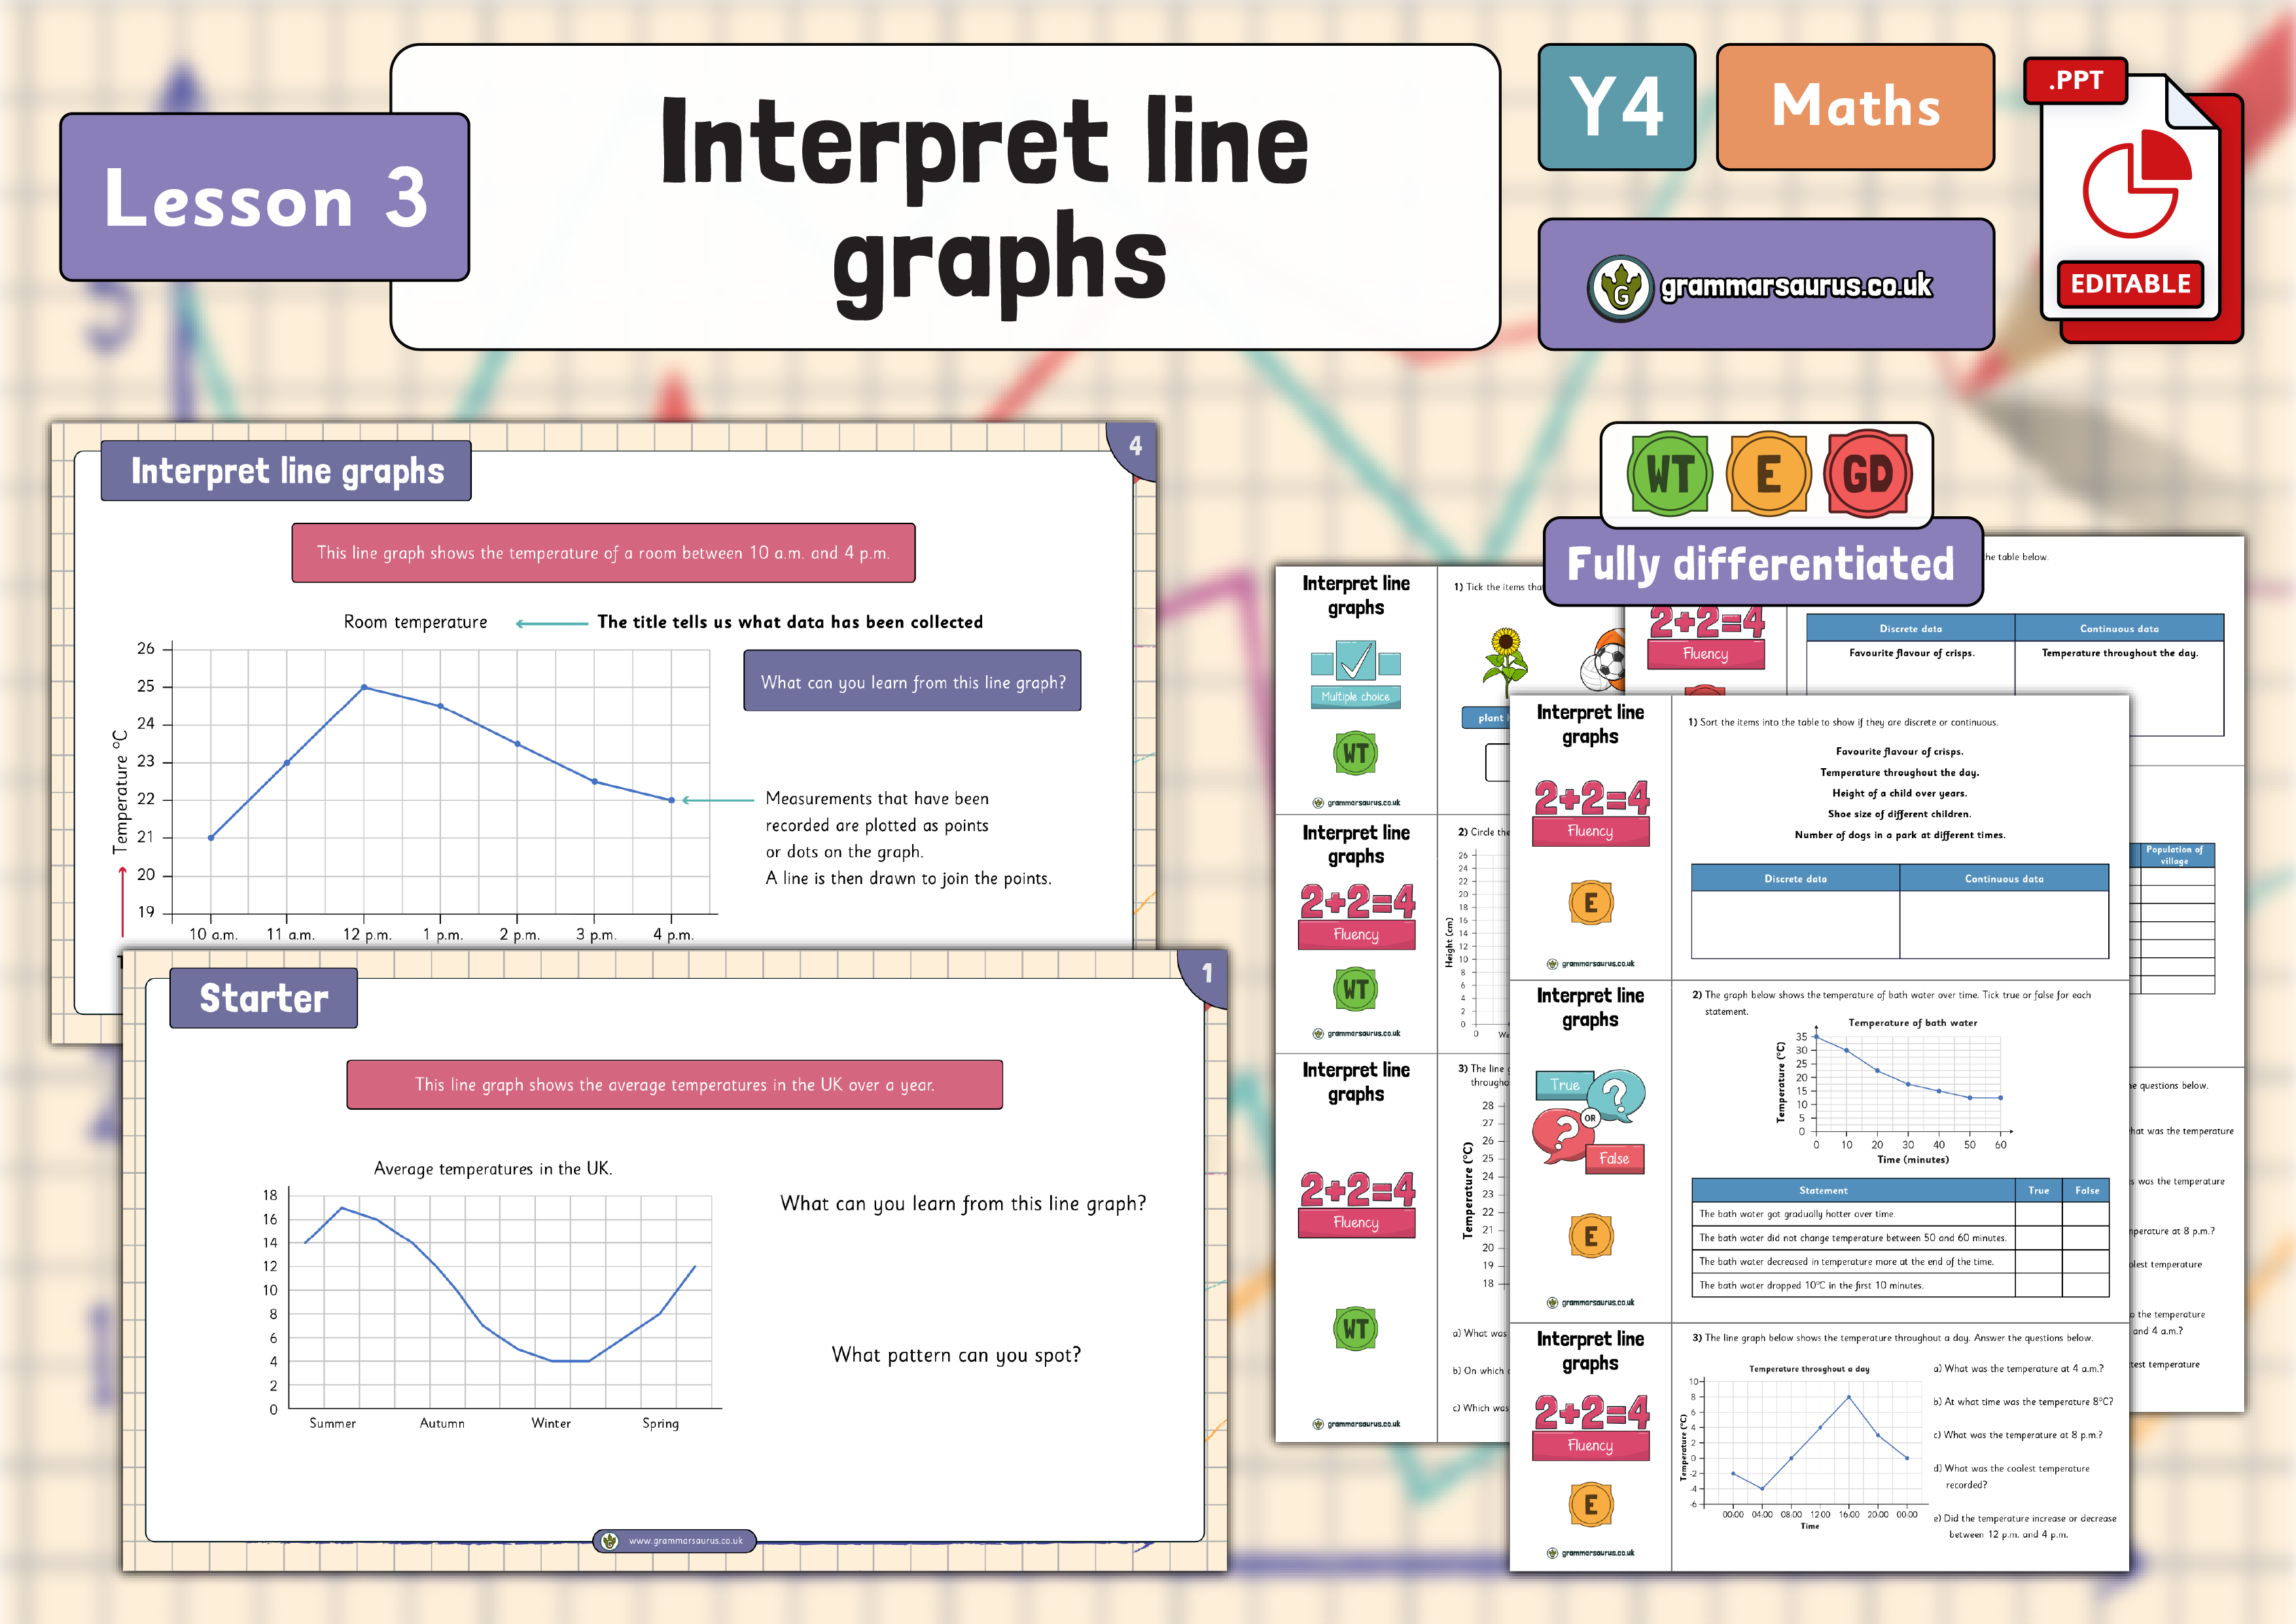
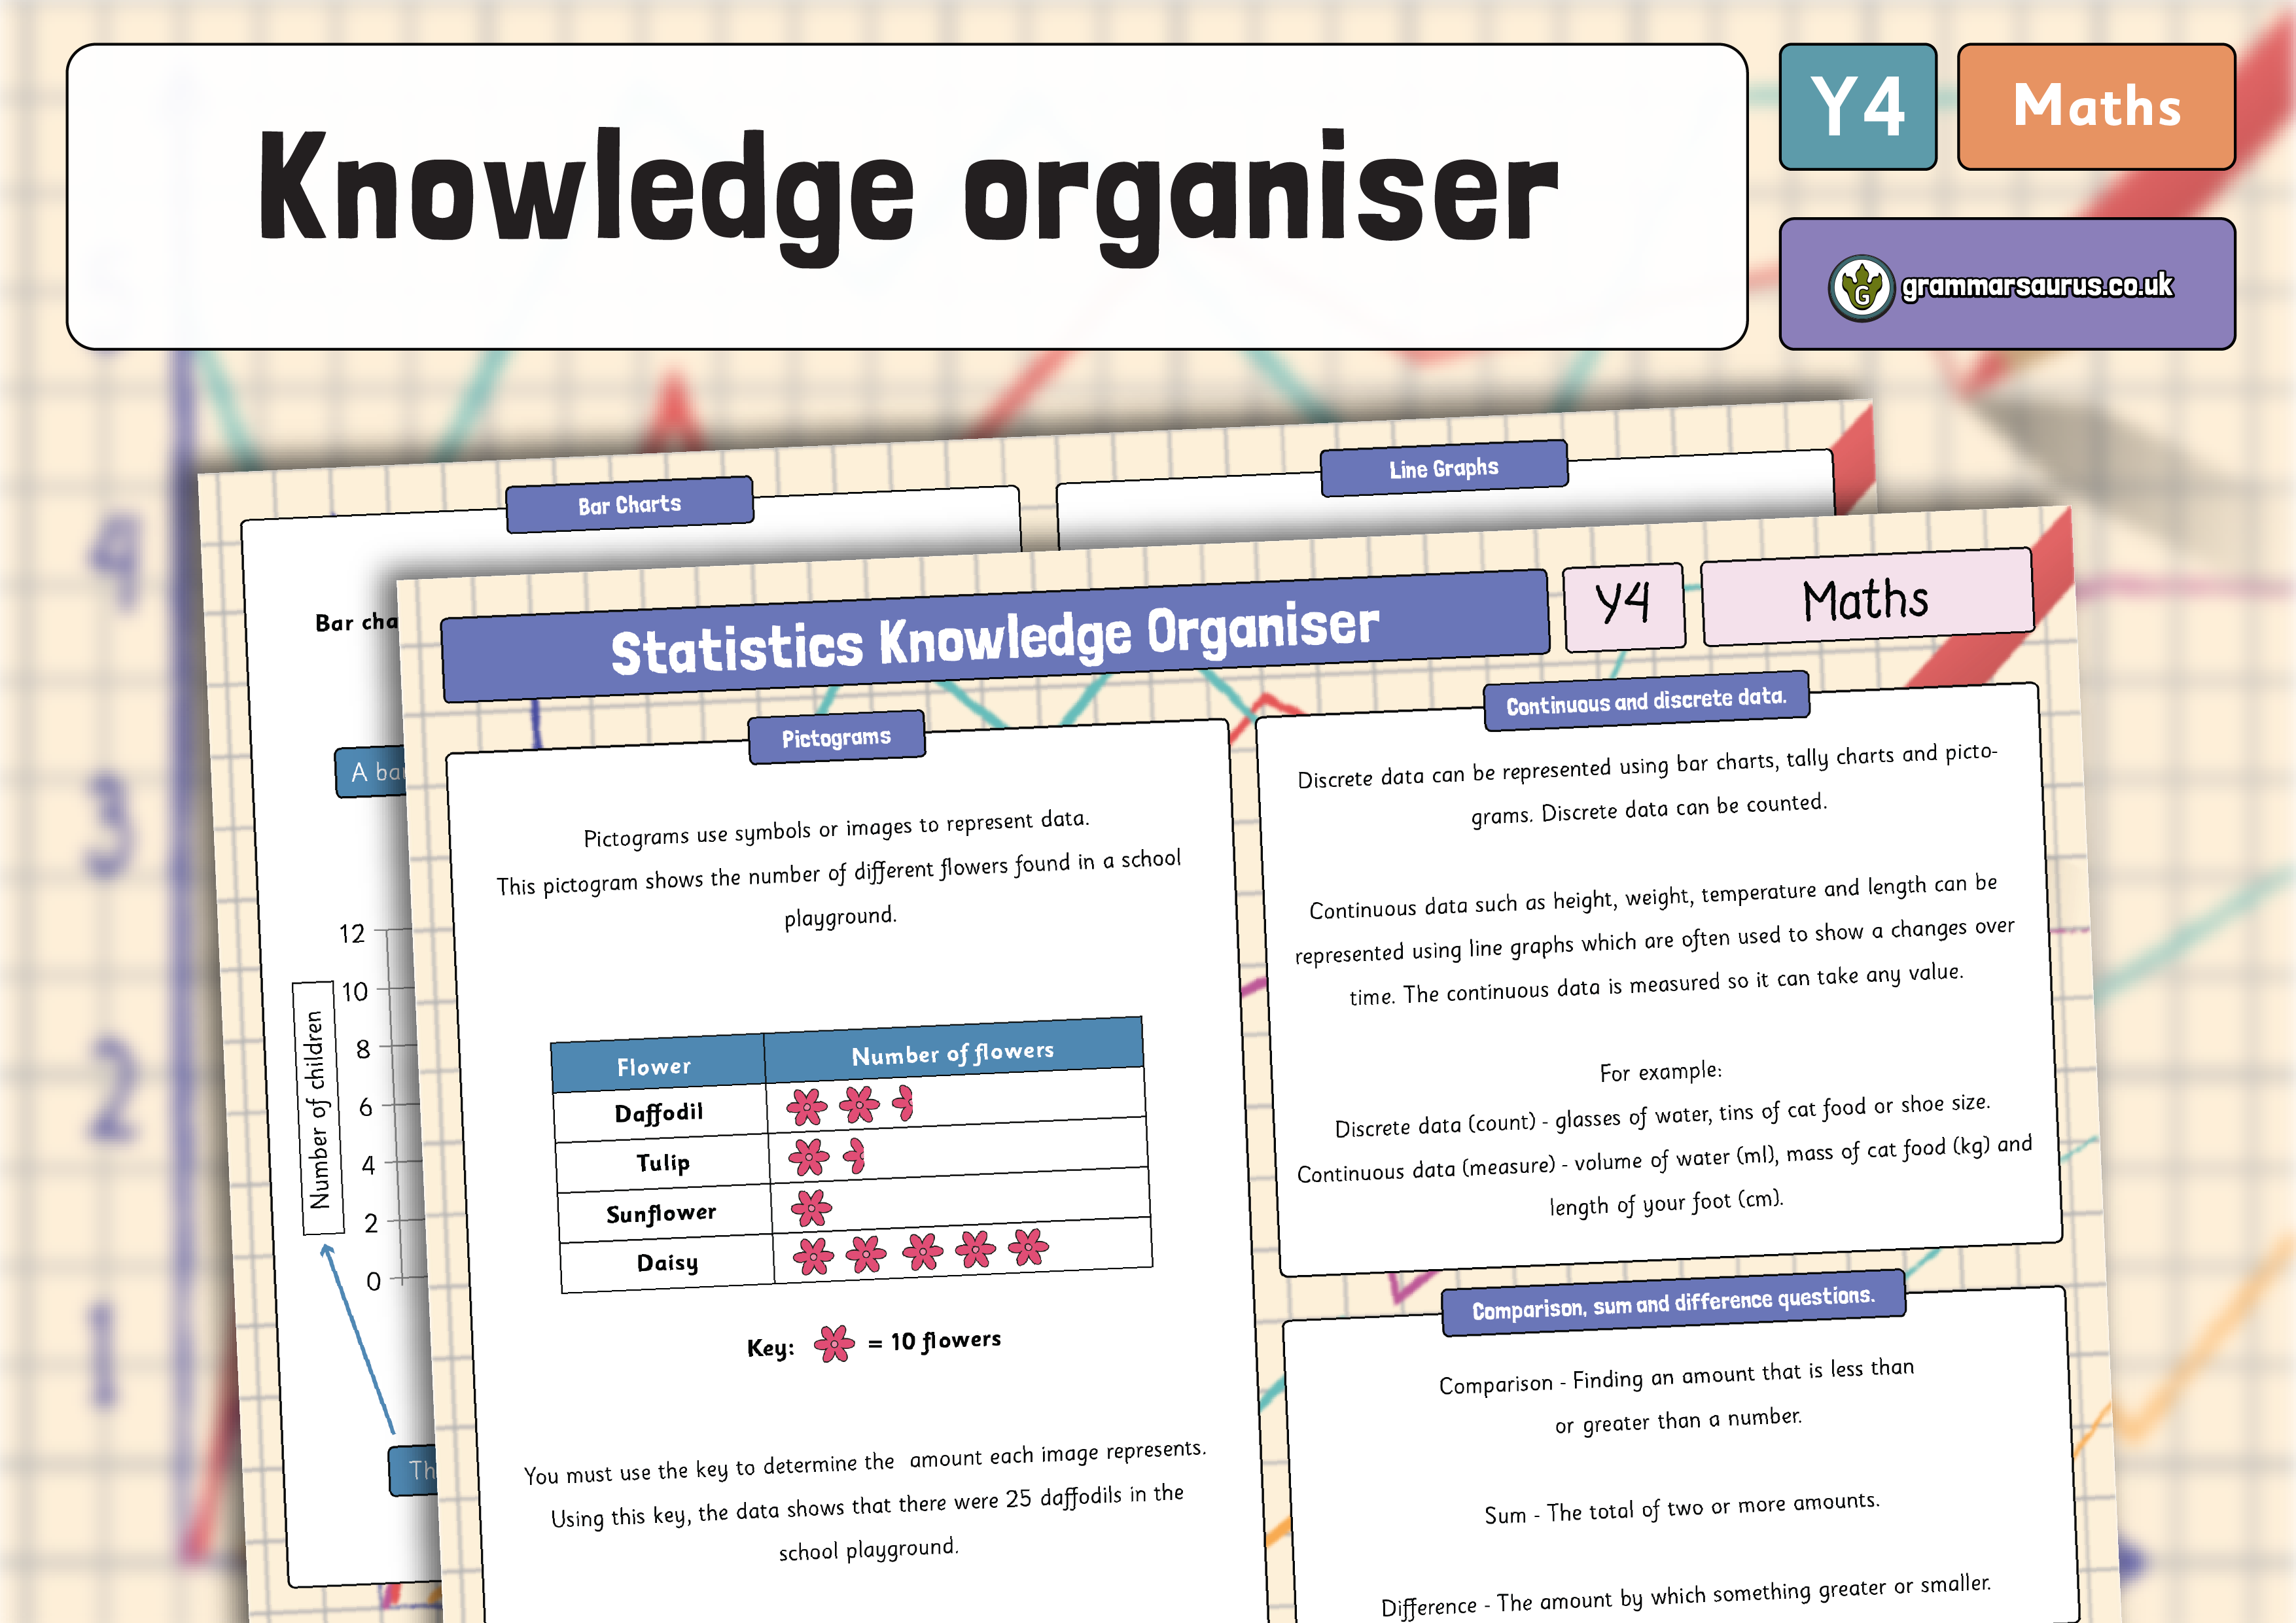
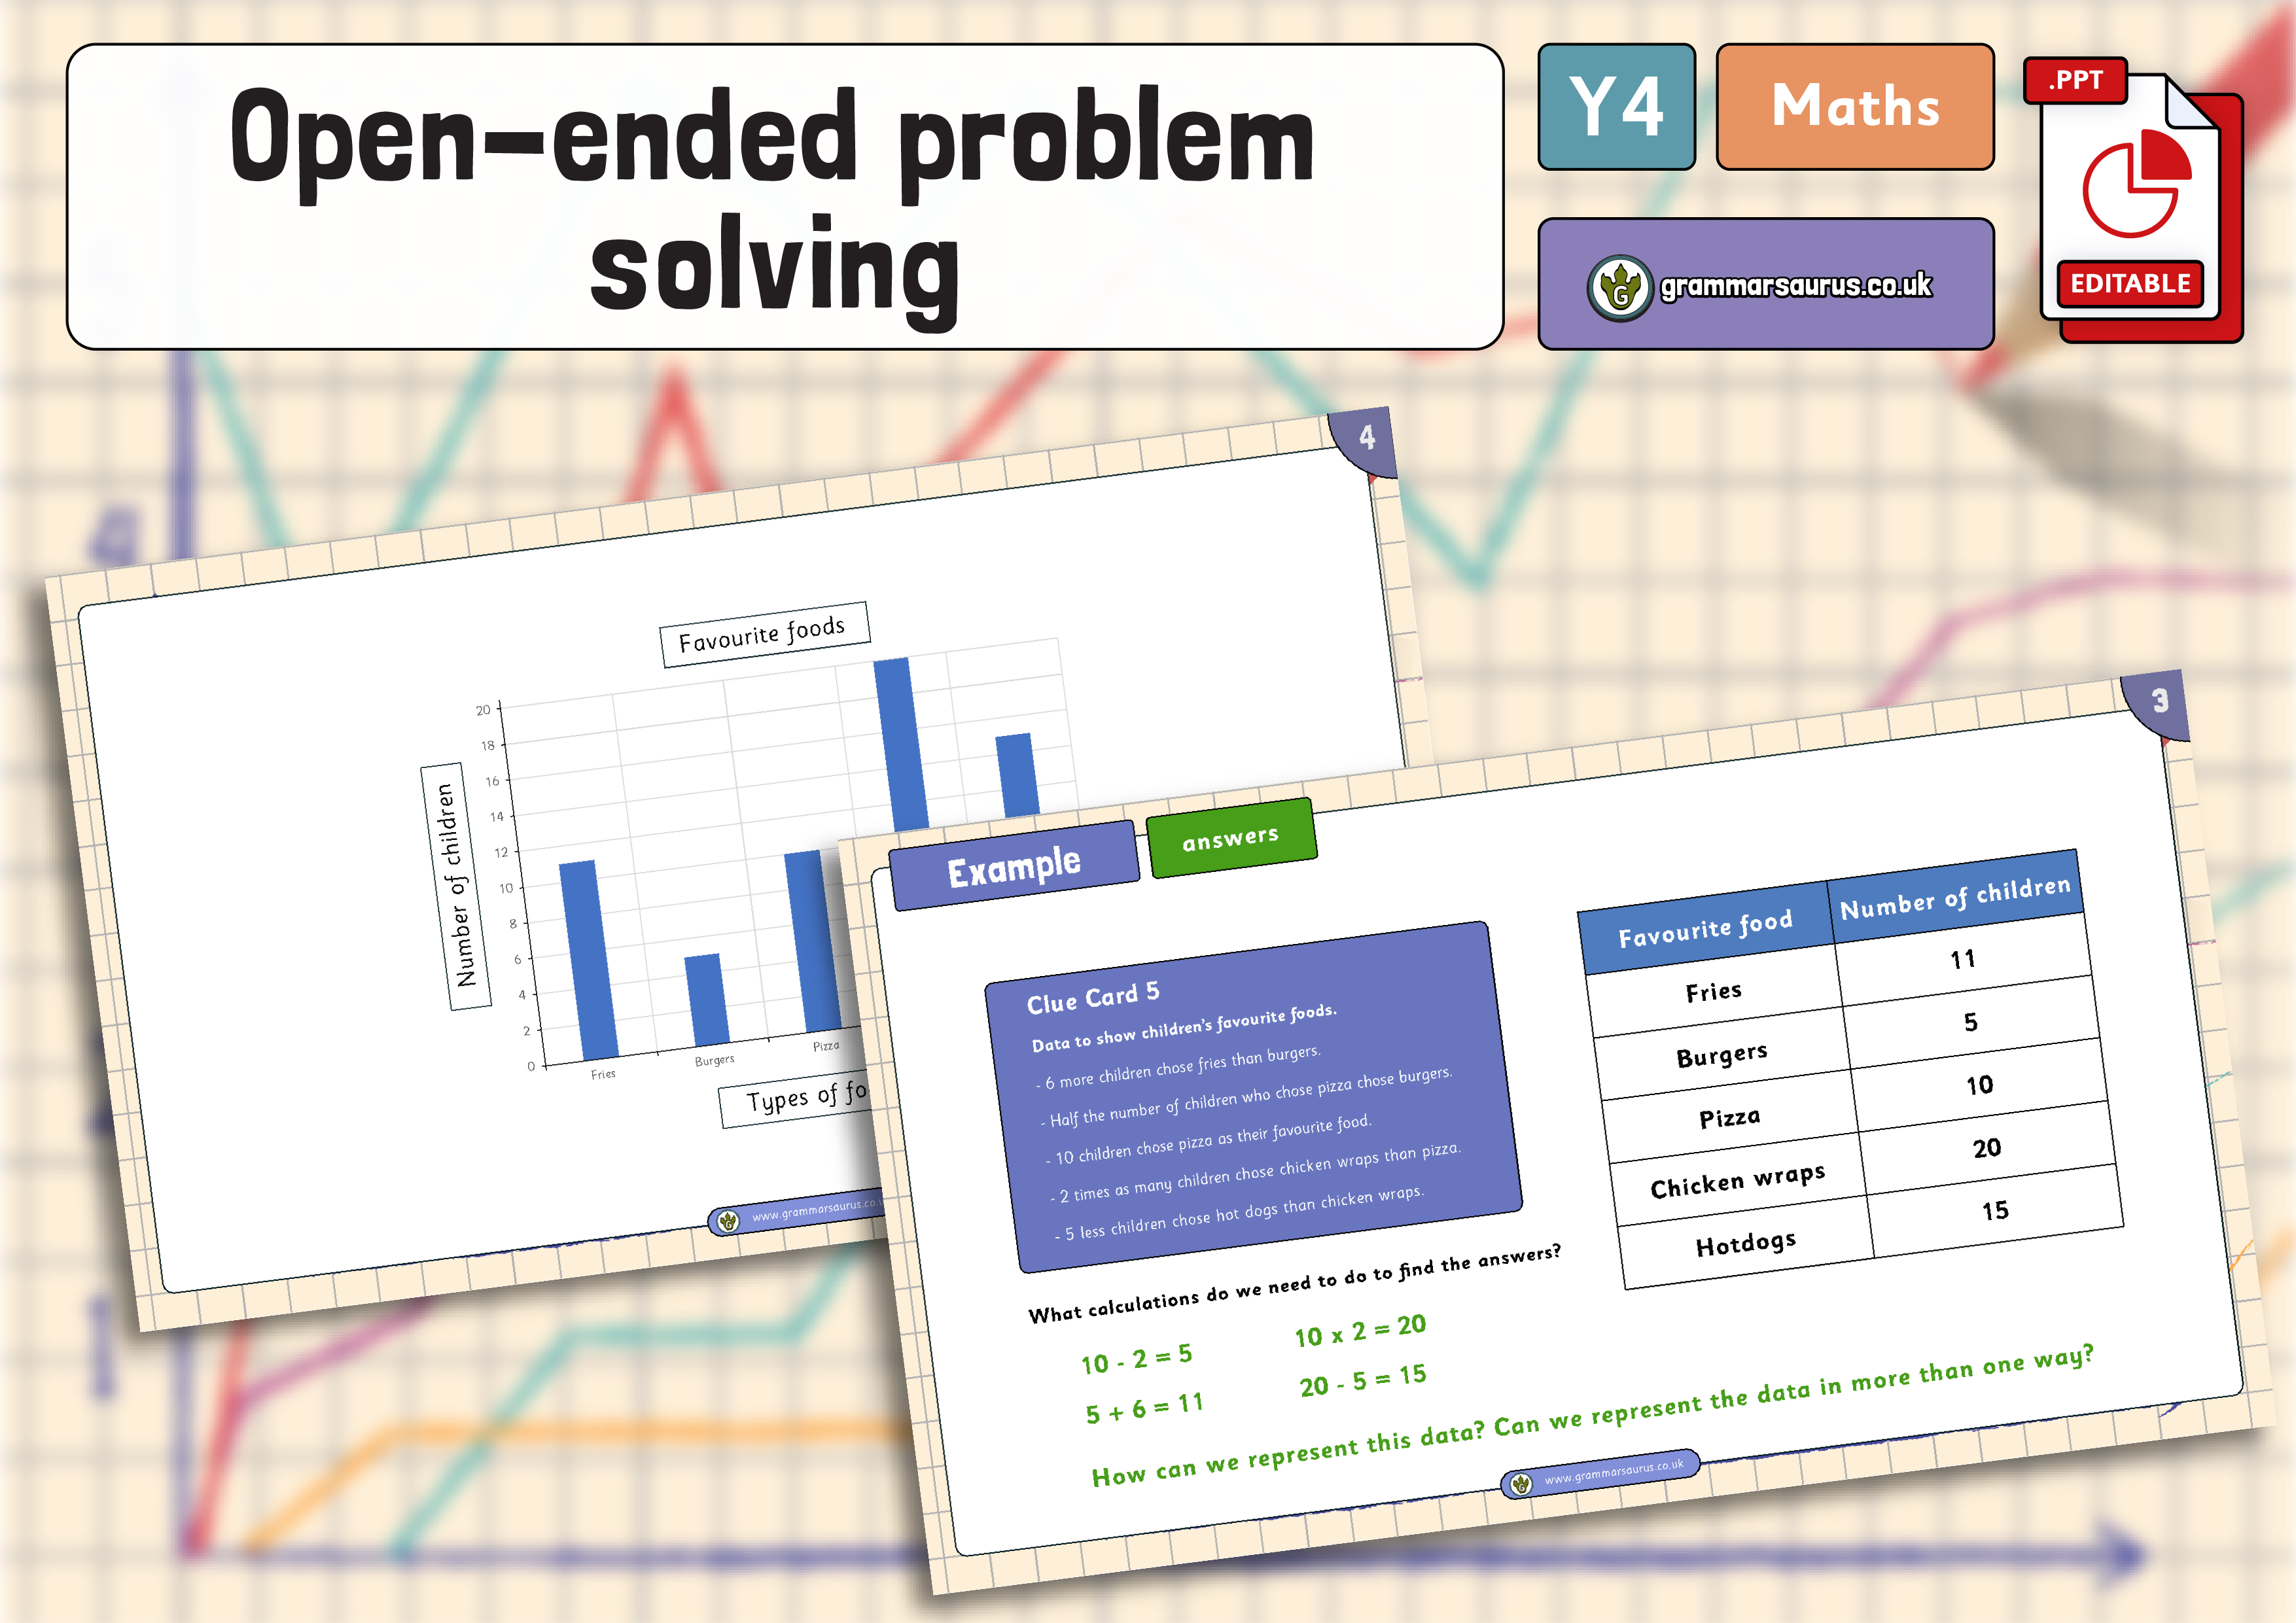
In this lesson, children build on the previous lesson to answer questions about line graphs but also learn how to accurately draw their own line graphs and represent data recorded in a table. There is a teaching presentation accompanied by differentiated activities with a range of fluency, reasoning and problem-solving questions.
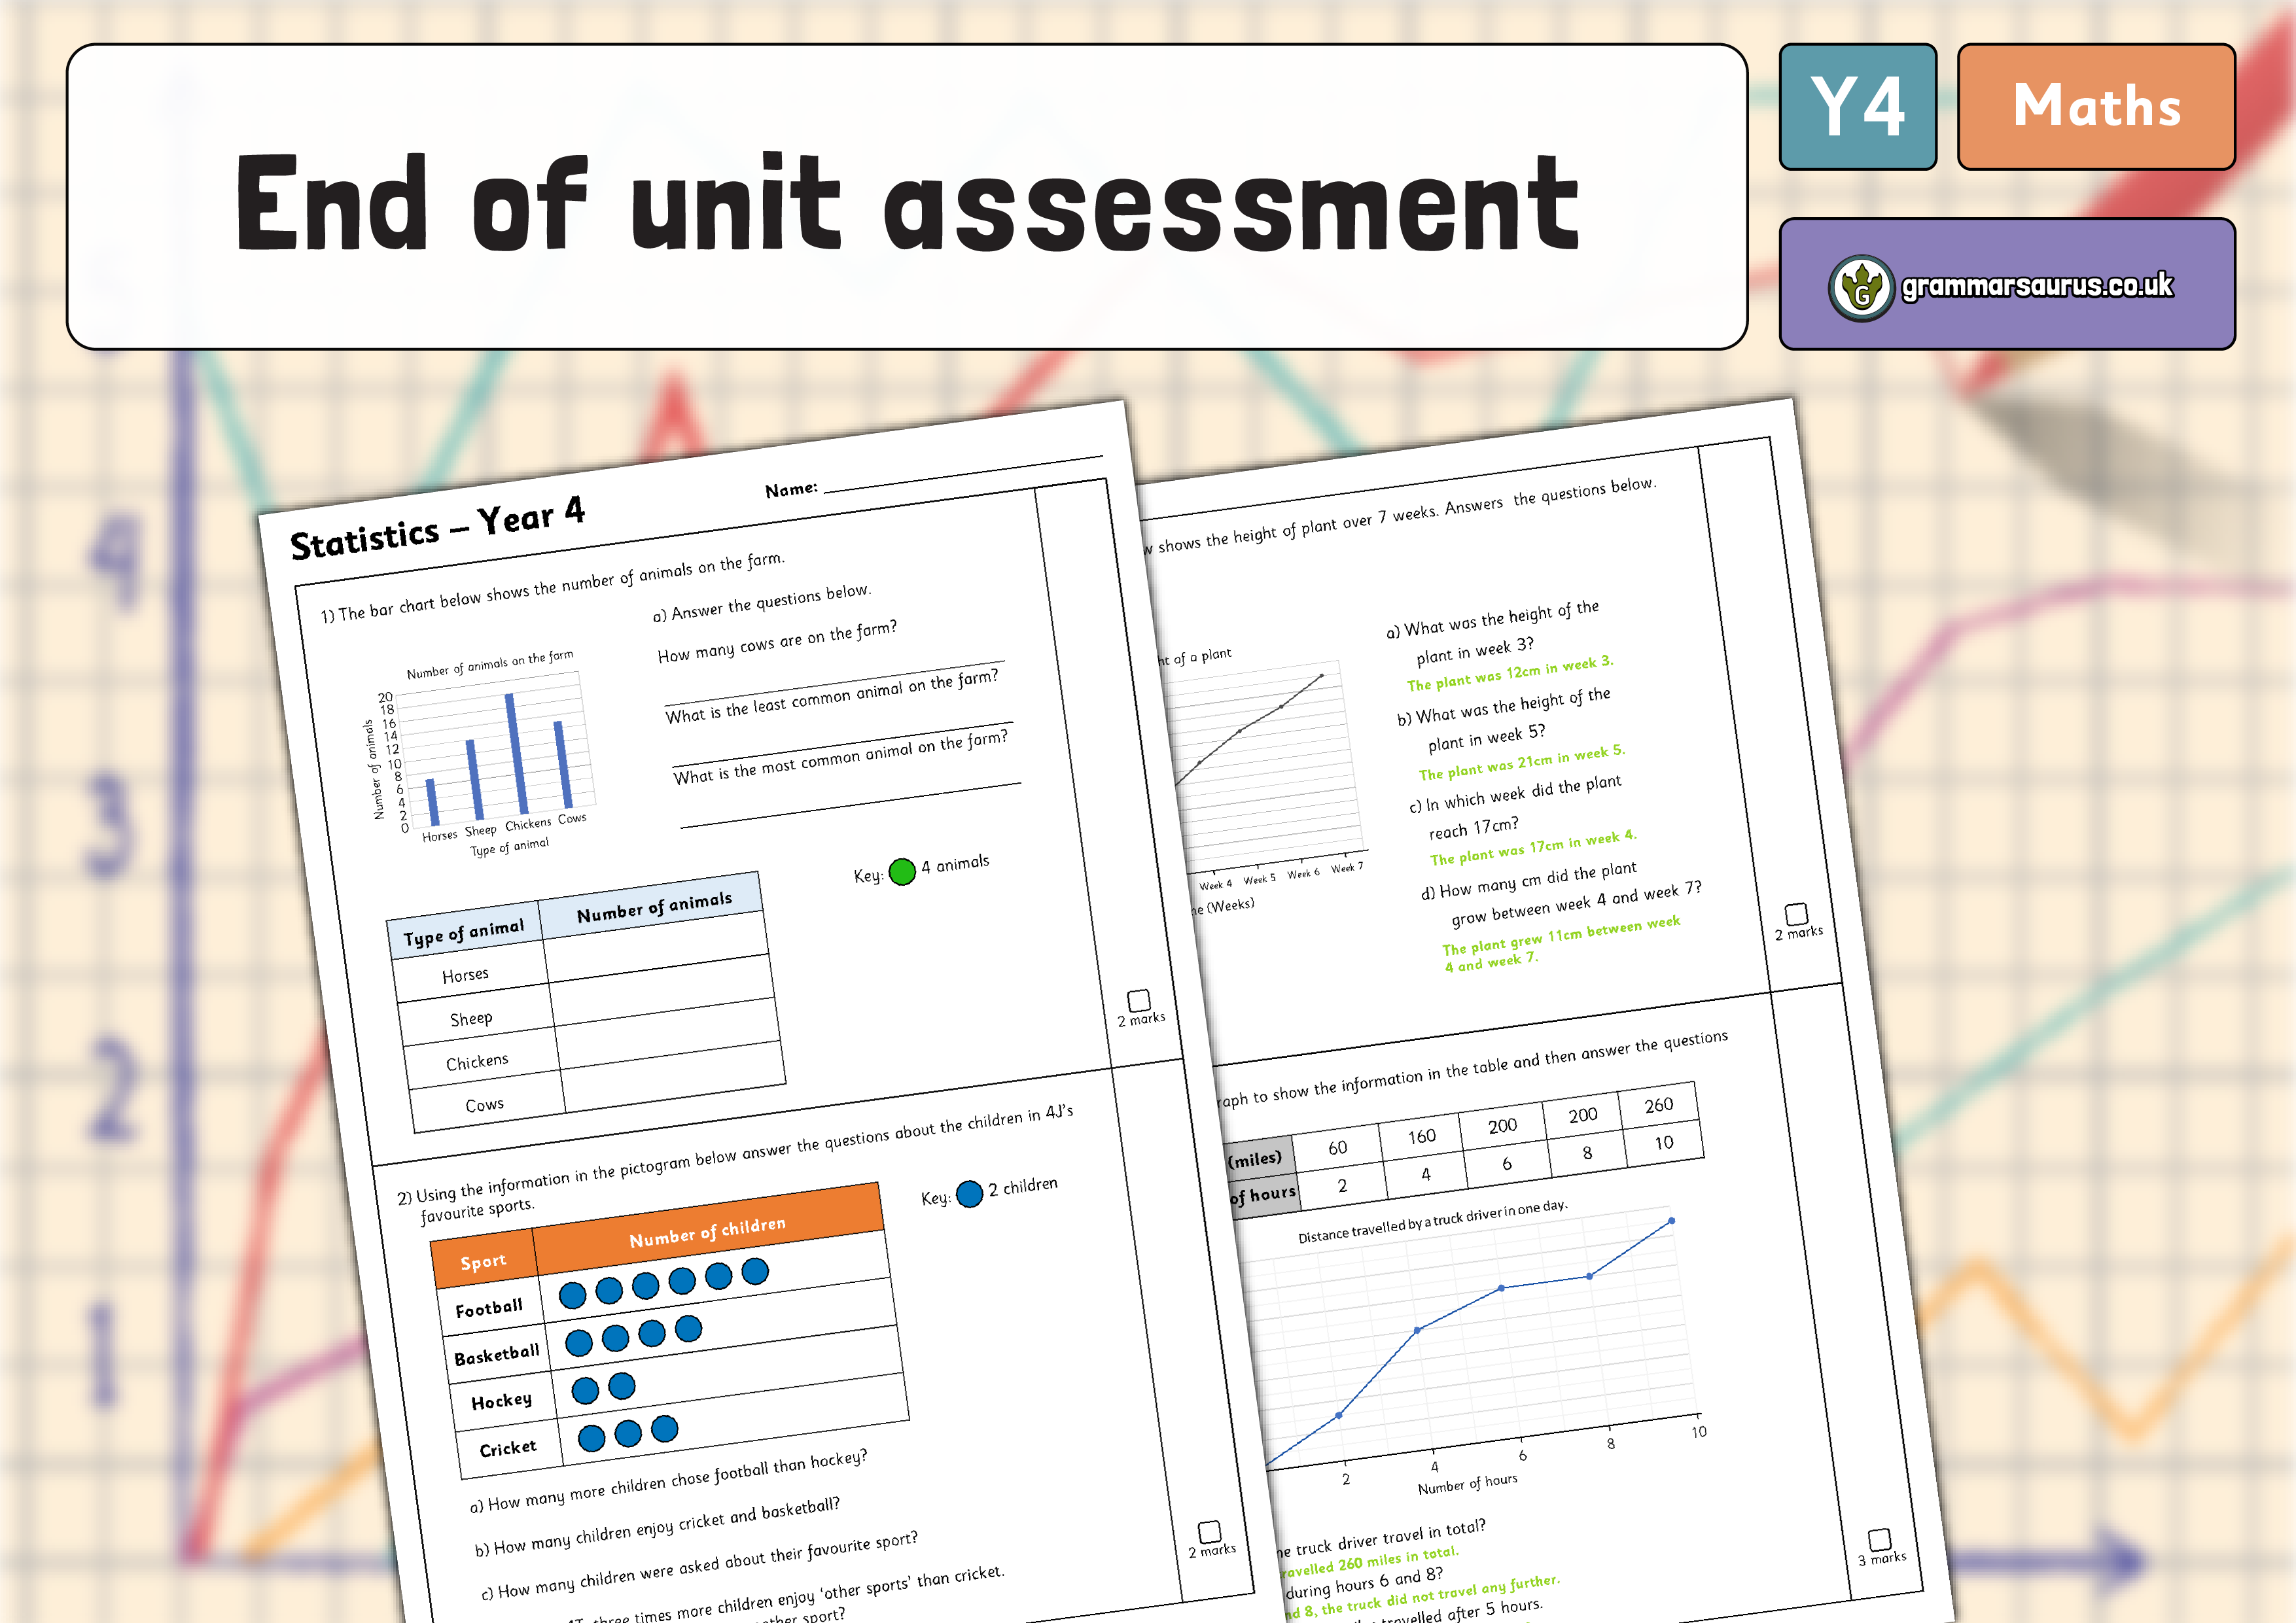
National Curriculum Objectives: Mathematics Year 4: -Interpret and present discrete and continuous data using appropriate graphical methods, including bar charts and time graphs. -Solve comparison, sum and difference problems using information presented in bar charts, pictograms, tables and other graphs
Differentiation: There are three levels of differentiation in this pack: ‘working towards,’ ‘expected’ and ‘greater depth’, as well as 3 sets of extra fluency questions.
Level of this Pack: Age: 8-9...
Hello,
Downloads are for members of Grammarsaurus only.
Please sign up below or login if you are already a member.
Hi! Sign in Or Solo sign up Or School sign up