Year 3 Statistics – Draw bar charts – Lesson 4
Year 3 Statistics – Draw bar charts – Lesson 4
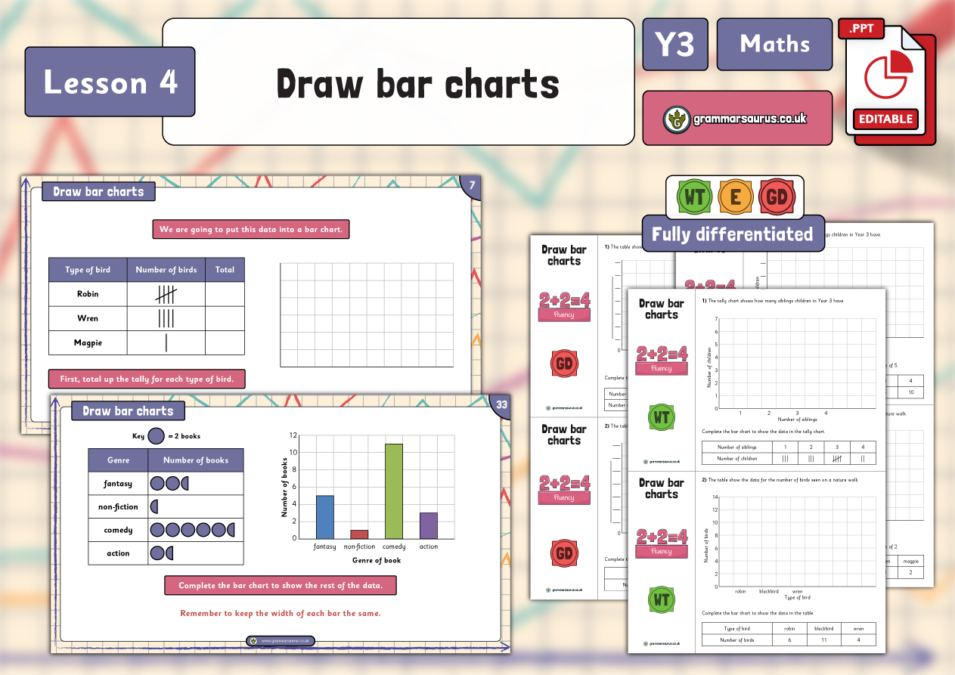
DescriptionIn this lesson, children develop their understanding from the previous lesson to construct their own bar charts based on a given data set. They are encouraged to choose an appropriate scale for the data and learn how to accurately draw bars to represent data. Scales are limited to 1, 2, 5 and 10. National Curriculum objectivesInterpret and present data using bar charts, pictograms and tables Solve one-step and two-step questions using information presented in scaled bar charts and pictograms and tables Differentiation There are three levels of differentiation in this pack: ‘working towards,’ ‘expected’ and ‘greater depth’. Levels of this packAge: 7-8 England & Wales: Year 3 Scotland: Primary 3 Rep. Ireland: 3rd Grade Australia: 3rd Grade USA: 3rd Grade...
Hello,
Downloads are for members of Grammarsaurus only.
Please sign up below or login if you are already a member.
Hi! Sign in Or Solo sign up Or School sign up