Solo sign up
 School sign up
Year 3 – Statistics – Collect and represent data – Lesson 5
Year 3 – Statistics – Collect and represent data – Lesson 5
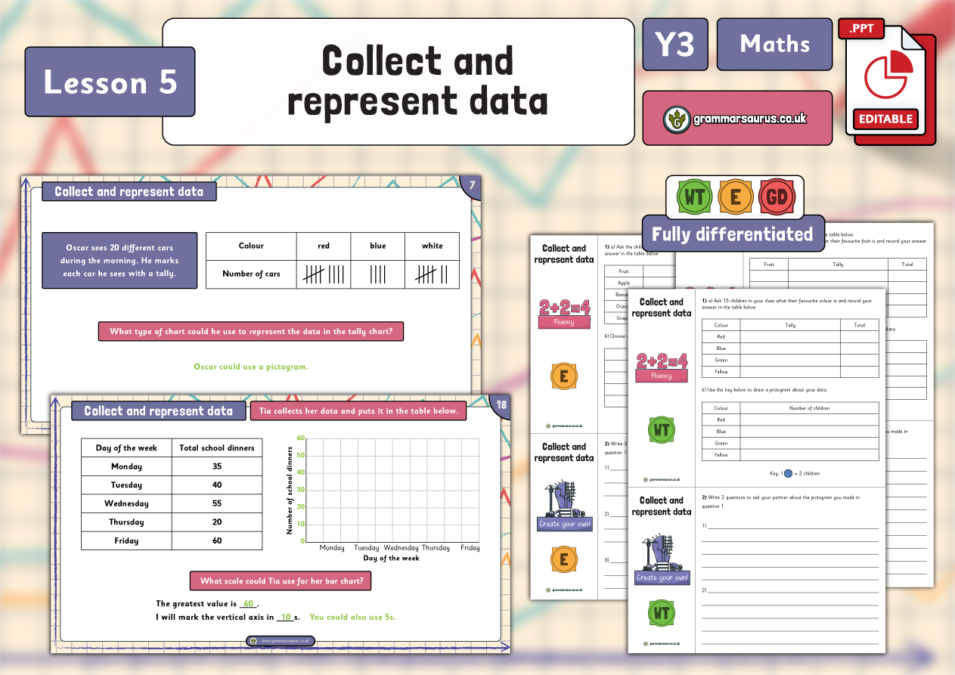
DescriptionIn this lesson, children develop understanding from the previous lessons and collect and represent their own data. They consider what questions to ask, how to collect the data and then how best to represent the data. National Curriculum objectivesInterpret and present data using bar charts, pictograms and tables Solve one-step and two-step questions using information presented in scaled bar charts and pictograms and tables Differentiation There are three levels of differentiation in this pack: ‘working towards,’ ‘expected’ and ‘greater depth’. Levels of this packAge: 7-8 England & Wales: Year 3 Scotland: Primary 3 Rep. Ireland: 3rd Grade Australia: 3rd Grade USA: 3rd Grade...
Hello,
Downloads are for members of Grammarsaurus only.
Please sign up below or login if you are already a member.
Hi! Sign in Or Solo sign up Or School sign up