Year 4 Statistics – Bar charts – Lesson 2
Year 4 Statistics – Bar charts – Lesson 2
Downloads are for members of Grammarsaurus only.
Grammarsaurus Gold Subscription - £49.99/year INC VAT
Grammarsaurus Gold Subscription - £49.99/year INC VAT
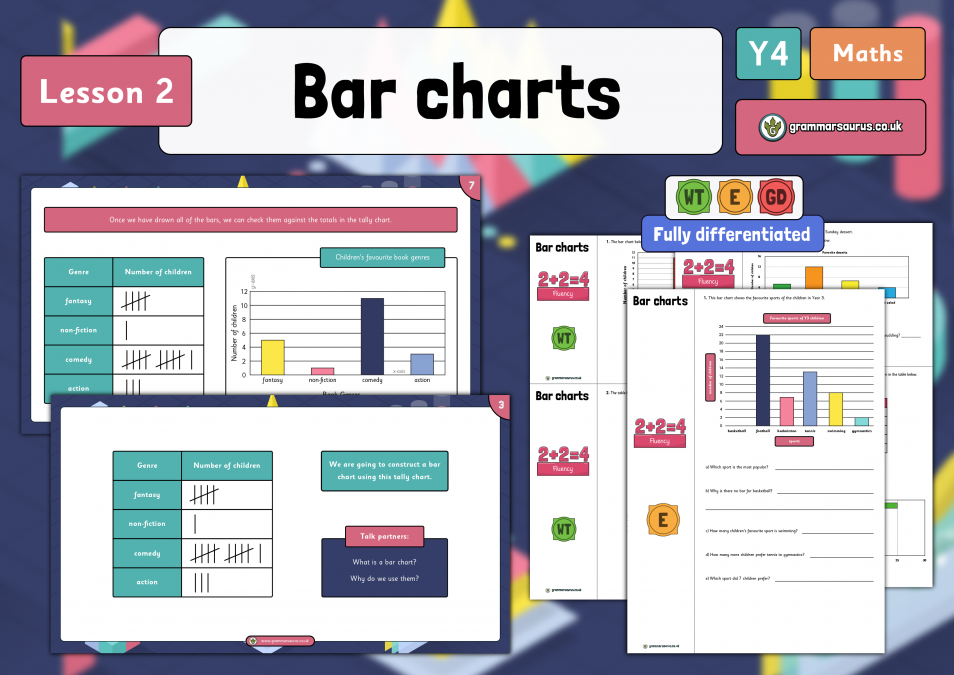
In this lesson, children build on their understanding of pictograms and tables and learn how to put this information into bar charts. A teaching presentation and resources with fluency and reasoning activities is available.
National Curriculum Objectives:
Mathematics Year 3:
interpret and present data using bar charts, pictograms and tables
solve one-step and two-step questions [for example ‘How many more?’ and ‘How many fewer?’] using information presented in scaled bar charts and pictograms and tables
Differentiation:
There are three levels of differentiation in this pack: ‘working towards,’ ‘expected’ and ‘greater depth’.
Level of this Pack:
Age: 8-9
England & Wales: Year 4
Scotland: Primary 4
Rep. Ireland: Third Class
Australia: Grade 3
USA: Grade 3
#Spring Block 3...
Hello,
Downloads are for members of Grammarsaurus only.
Please sign up below or login if you are already a member.